CBSE Class 9 - Graphical Representation of Data Videos
Histogram
This video explains how to draw an histogram and finding the different values based on that
More videos from this chapter
View All-
Grouping and Tabulation of Data
-
...
-
Grouping and Tabulation of Data
-
Cumulative Frequency of a particular class-interval ...
-
Cumulative Frequency of a particular class-interval ...
- Q-16 Make a frequency polygon for given frequency table (5) - Class Interval Frequency Section A Section B 3 0 - 5 2 5 - 10 3 5 10 - 15 4 2 15 - 20 1 3 20 - 25 5 4 25 - 30 3 2
- Draw a distance time graph and give nature Distance in meter 7,10,17,22,26,37, Time in seconds 2,4,6,8,10,12,14
-
-
-
Following is the data of students opting for various courses in Delhi University:
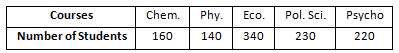 Represent the above data using bar graph.
-
-
-
-
-