
CBSE Class 7 Maths Organization and Representing Data
-
Organising and Representing data
 Organising and presenting data in textual format ,tabular format
- Following data gives total marks (out of 500) obtained by 5 studets of class vii.Represent the data by a bar graph. Student Ayay Raj Desu Deepak Sonal Marks obtained 350 375 400 450 485 Which student get maximum marks?
- Consider the following data gathered from a survey of a colony: Favourite sport Cricket Basket ball Swimming Hockey Athletics Watching 1200 460 510 600 1000 Participating 620 390 455 790 450 Draw a double bar graph choosing an appropriate scale.
-
 Identify the following terms from the above graph: (a) Graph title (b) Scale (c) Grouped data axis (d) Frequency data axis
-
 Use the bar graph above to answer the following questions: (a) What was the most popular career chosen by middle school students? (b) What was the least popular career chosen by middle school students? (c) Which career was chosen by 103 students?
-
The following bar graph shows voting results of the colour preference of students.
 (a) How many students chose blue as their favorite color? (b) How many more students chose green than red? (c) How many more students voted for purple than red? (d) Do any two colors have the same number of votes? (e) How many students chose purple? (f) If three more students voted for green, how many votes would green have?
-
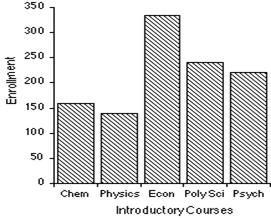 From the above graph, answer the following questions: (a) Which course has the maximum students enrolled in it? (b) Order the courses in terms of enrollment from lowest to highest. (c) The enrollment in Economics is approximately how many times bigger than the enrollment in Chemistry? (d) Approximately how many students were enrolled in the course with the maximum students?
-
 Answer the following questions from the above graph: (a) The title of this graph is_________ (b) The horizontal axis shows________ (c) The vertical axis shows__________ (d) The color of car which got sold the most is _______
-
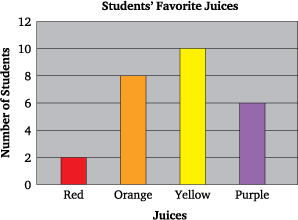 Read the following graph and answer the following questions: (a) What is the title of the graph? (b) What is the difference between the numbers of students who drink red juice and the ones who drink purple juice? (c) What is interval taken in this graph?
-
Given is a table representing marks obtained by 40 students in an examination:
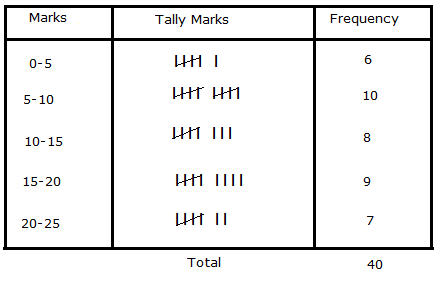 State the class intervals, class size and the class mark.
- What is data and what is the need to organize data?
