CBSE Class 6 Maths Organisation and Representation of Data
-
Study the following tally chart and answer the following questions.
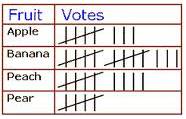 (a) Count the number of votes for Banana. (b) Count the number of votes for Pear.
-
Study the following chart and answer the questions given below.
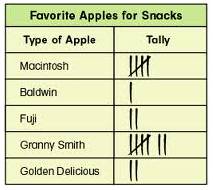 (a) Which type of Apple is most favourite? (b) Which type of Apple is less favourite?
-
Following table represents the mode of transport for students of class VI.
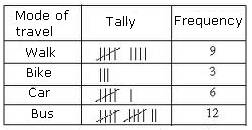 Study the graph and answer the following. (a) Total number of students in class VI. (b) Which transport is used by highest number of students?
-
Make another column in the following table showing frequency for each drink.
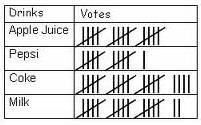
-
Following are the marks obtained by a class in a math test out of 10.
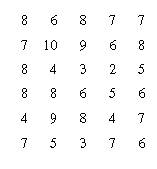 Prepare a tally chart for the marks.
- Represent the following table in the form of tally mark. Mobile Brand Number of users Nokia 14 Samsung 16 Sony 7 LG 12
-
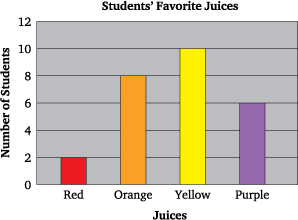 Read the following graph and answer the following question? 1. What is the title of the table? 2. What is the difference between the numbers of students who drink red juice and the ones who drink purple juice? 3. What is interval taken in this graph?
-
Study the following chart and answer the questions that follow:
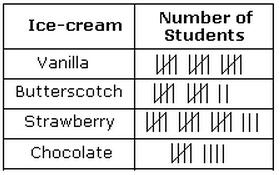 (a) How many students like butterscotch ice-cream?
(b) Which flavor of ice-cream is liked by less number of students?
-
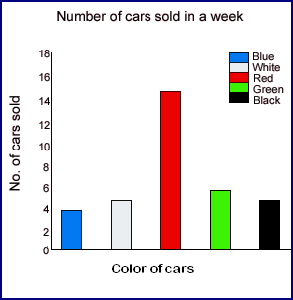 Answer the following questions? 1. The title of this graph is? 2. The horizontal axis shows? 3. The vertical axis shows? 4. The color of car which got sold the most is?
- Organize the following data in tally chart. Subjects Number of Students English 10 Hindi 8 Math 17 Science 12

