Class 11-commerce TR JAIN AND VK OHRI Solutions Statistics for Economics Chapter 6 - Diagrammatic Presentation of Data- Bar Diagrams and Pies Diagrams
Diagrammatic Presentation of Data- Bar Diagrams and Pies Diagrams Exercise 109
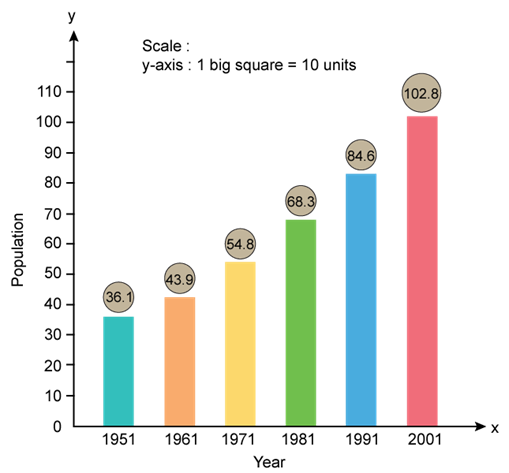
Solution SAQ 1
Population of India (Rs crore)
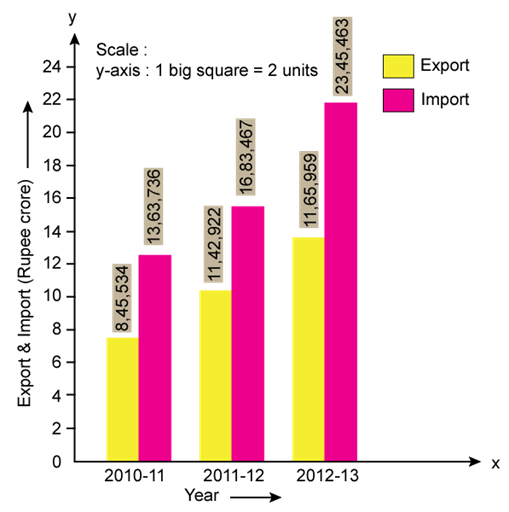
Solution SAQ 2
India's Exports and Imports (Rs crore)
Diagrammatic Presentation of Data- Bar Diagrams and Pies Diagrams Exercise 110
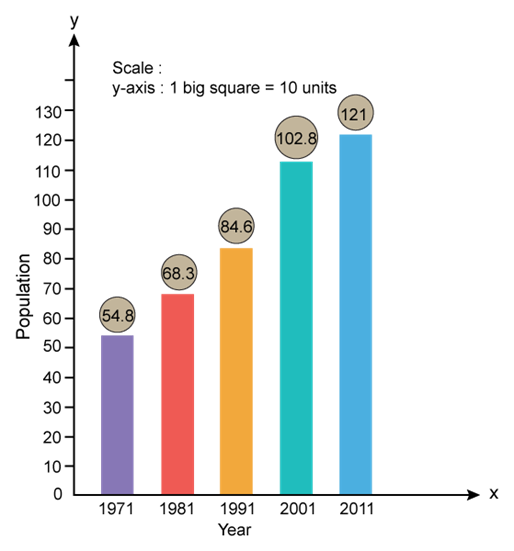
Solution SAQ 3
India's Population (Rs crore)
Solution SAQ 4
Number of Students in different Streams
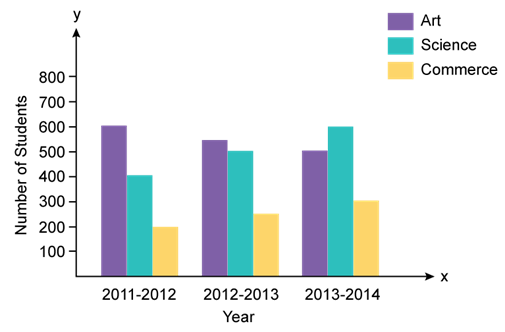
Solution SAQ 5
Cost of Production of Commodities
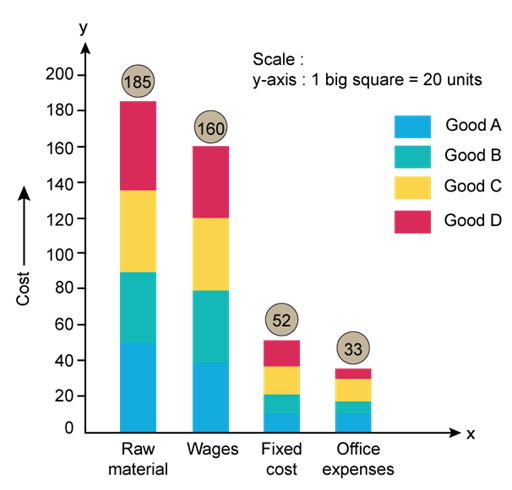
Solution SAQ 6
Multiple Bar Diagram
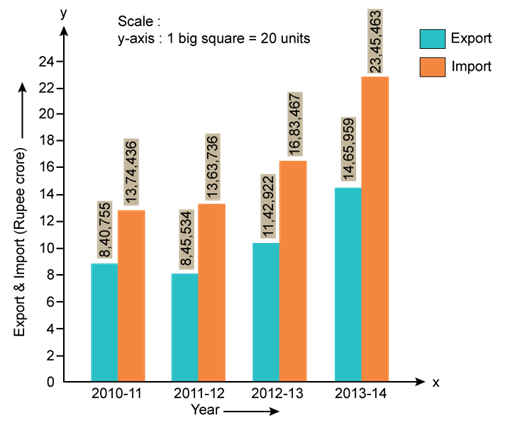
Solution SAQ 7
Circular diagram also known as pie diagram shows the percentage values of a series which is presented in a circle divided into various segments.

Pie Diagram
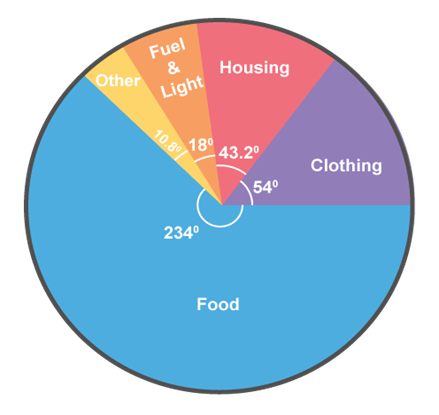
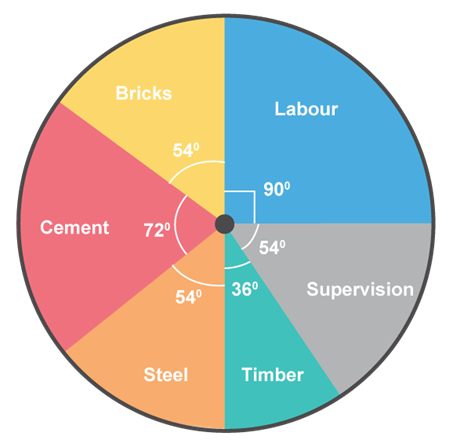
Solution SAQ 8

Pie diagram
Diagrammatic Presentation of Data- Bar Diagrams and Pies Diagrams Exercise 111
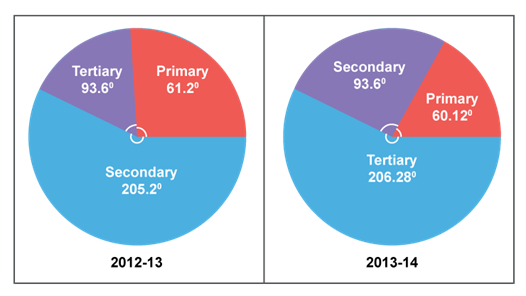
Solution SAQ 9
|
2012-2013 |
2013-2014 |
||||
|
Sector |
% contribution |
Degree Share |
Sector |
% contribution |
Degree Share |
|
Primary |
17 |
17 × 36/100=61.2 |
Primary |
16.7 |
16.7 × 36/100=60.120 |
|
Secondary |
57 |
57 × 36/100=205 |
Secondary |
26 |
26 × 36/100=93.60 |
|
Tertiary |
26 |
26 × 36/100=93.6 |
Tertiary |
57.3 |
57.3 × 36/100=206.280 |
Solution SAQ 10
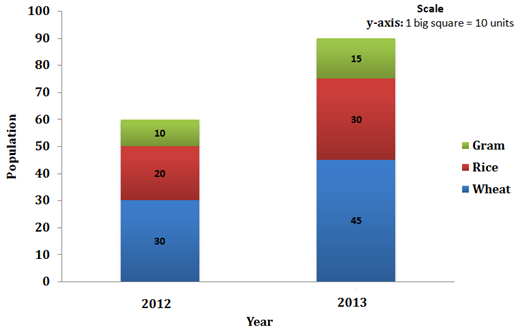
Production of Food Grains
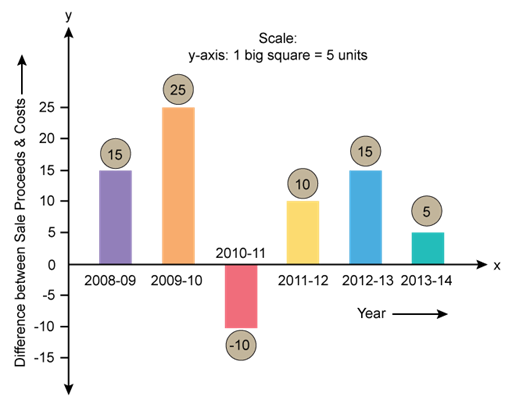
Solution SAQ 11
|
Year |
Sale Proceeds |
Costs |
Sale Proceeds - Cost |
|
2008 - 09 |
115 |
100 |
15 |
|
2009 - 10 |
140 |
115 |
25 |
|
2010 - 11 |
145 |
155 |
-10 |
|
2011 - 12 |
150 |
140 |
10 |
|
2012 - 13 |
160 |
145 |
15 |
|
2013 - 14 |
170 |
165 |
5 |
