Class 11-commerce NCERT Solutions Economics Chapter 2: Theory of Consumer Behaviour
Theory of Consumer Behaviour Exercise 34
Solution 1
The group of all the bundles which the consumer is able to buy with his/her income at the prevailing prices in the market is called the budget set of a consumer.
The budget set of a consumer is basically a collection of all bundles of goods and services which a consumer can purchase by using the available income.
Solution 2
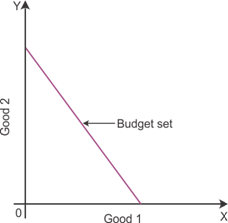
The budget line represents two different combinations of goods which a consumer can purchase with the given income and prices of commodities.
For example,
Q1 be the amount of Good 1.
Q2 be the amount of Good 2.
P1 be the price of Good 1.
P2 be the price of Good 2.
P1q1 = Total money spent on Good 1
P2q2 = Total money spent on Good 2
Therefore, the equation of the budget line will be p1q1 + p2q2 = X
The budget set can be shown in the below diagram:

Solution 3
The budget line is downward sloping so that a consumer can increase the consumption of Good 1 only by decreasing the consumption of Good 2.
If consumers desire to have one additional unit of Good 1, then they can only have that additional unit if they manage to give up some quantity of other good.
Consumers have limited income. They have to decide whether to spend on either Good 1 or Good 2.
Solution 4
1. Given that
p1 = Rs 4 and p2 = Rs 5
So, X = Rs 20
Therefore, the equation of the budget line will be p1q1 + p2q2 = X
i.e. 4q1 + 5q2 = 20
2. Given that
Total income of the consumer = Rs 20
Price of Good 1 per unit = Rs 4
Hence, consumers can purchase Good 1 by spending their entire income = 20/4 = 5 units.
3. Given that
Total income of the consumer = Rs 20
Price of Good 1 per unit = Rs 5
Hence, consumers can purchase by spending entire income = 20/5 = 4 units.
4. Slope of the budget line = -price of Good 1/price of Good 2, i.e. -p1/p2
=-4/5 =-0.8
Solution 5
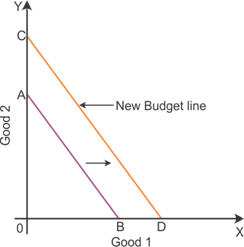
The budget line will shift rightwards because of an increase in the level of income. The following diagram indicates the changes in the budget line.

The above diagram indicates that there is a parallel shift in the new budget line CD. Consumers tend to buy more goods and services when there is an increase in their level of income. An increase in the level of income raises the purchasing power of consumers.
Solution 6
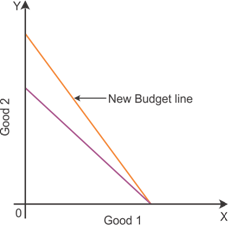
Decrease in the price of Good 2 causes a rightward shift in the budget line on the vertical axis. The following diagram represents the changes in the budget line if the price of Good 2 decreases by a rupee, but the price of Good 1 and the consumer's income remain unchanged.

The above diagram shows that a consumer will buy more goods of Good 2 rather than Good 1. Also, comparatively more consumption of Good 2 makes the budget line steeper than the previous budget line.
Solution 7
When the prices and the income double, there will be no impact on the budget set.
According to the equation, the budget line is p1q1 + p2q2 = X.
However, if the prices and income of the consumer double, then the budget set will be
2p1q1 + 2p2q2 = X
2(p1q1 + p2q2) = 2X
P1q1 + p2q2 = X
Hence, the budget set will not be affected because of equal changes in the price and level of income.
Solution 8
Price of Good 1 = 6
Price of Good 2 = 8
Consumer can afford to buy 6 units of Good 1 and 8 units of Good 2
Putting the above values in the below formula,

Hence, the income of the consumer is Rs 100.
Solution 9
(i)
If the consumer's income is Rs 40 and the two goods are equally priced at Rs 10, then the following bundles can be available to consumers (assuming that the bundles will cost Rs 40 or less).
|
(0, 0) |
(0, 1) |
(0, 2) |
(0, 3) |
(0, 4) |
|
(1, 0) |
(1, 1) |
(1, 2) |
(1, 3) |
(1, 4) |
|
(2, 0) |
(2, 1) |
(2, 2) |
(2, 3) |
(2, 4) |
|
(3, 0) |
(3, 1) |
(3, 2) |
(3, 3) |
(3, 4) |
|
(4, 0) |
(4, 1) |
(4, 2) |
(4, 3) |
(4, 4) |
(ii)
The following are the bundles which are available to a consumer which will cost exactly Rs 40.
|
(4, 0) |
(1, 3) |
(2, 2) |
(0, 4) |
The bundles of goods indicate that a consumer does not have to spend more than or less than Rs 40 as these bundles cost exactly Rs 40.
Solution 10
Monotonic preferences refer to a bundle of goods and services which is preferred by a consumer over the other bundles of goods and services.
Monotonic preferences give higher satisfaction to customers. Consumers often prefer bundles of goods and services which give comparatively higher level of satisfaction.
Solution 11
A consumer cannot be indifferent between the bundles (10, 8) and (8, 6) because the first bundle of goods has more quantity than the second one.
Consumers often prefer bundles of goods and services which give comparatively higher level of satisfaction. The second bundle of goods has comparatively less quantity than the first one. Hence, a consumer cannot be indifferent between the bundles (10, 8) and (8, 6).
Solution 12
A consumer will always prefer a bundle that gives more satisfaction than the other bundles of goods and services. A bundle of goods which comprises more quantity is always preferred by consumers.
If a consumer's preferences are monotonic then he/she would rank her/his preferences as follows.
1. (10, 10)
2. (10, 9)
3. (9, 9)
Theory of Consumer Behaviour Exercise 35
Solution 13
The preferences of a friend are not monotonic because they are indifferent between the bundles of goods which have different number of quantities.
Monotonic preferences refer to a bundle of goods and services which is preferred by a consumer over the other bundles of goods and services.
In the above case, a consumer is indifferent between the bundles of goods (5, 6) and (6, 6).
Solution 14
From the given demand functions, it shows that consumers do not want to buy goods and services when the price is more than Rs. 15.
Consumers wish to purchase goods when the price is equal or less than Rs. 15. Hence, the market demand function can be derived as below:

The above equation shows that both consumers are more willing to buy goods at a price less than Rs 15.
Solution 15
The above identical demand functions indicate that consumers are willing to demand goods when the price is equal to or less than 10/3.
The demand is zero when the price of goods is greater than 10/3. Thus, the market demand will be as follows:

Solution 16
The market demand can be calculated by considering the individual's demand in the market. The market demand for the above data is calculated as below:
|
P |
D1 |
D2 |
Market Demand |
|
1 |
9 |
24 |
33 |
|
2 |
8 |
20 |
28 |
|
3 |
7 |
18 |
25 |
|
4 |
6 |
16 |
22 |
|
5 |
5 |
14 |
19 |
|
6 |
4 |
12 |
16 |
The market demand indicates that there is an inverse relationship between the market price of goods and the quantity demanded for those goods.
Solution 17
A normal good is a good whose demand rises with a rise in the level of income and reduces with a reduction the income level. Individuals often tend to buy more normal goods when their level of income rises.
There is a positive relationship between the level of income and the demand for normal goods. For example, the demand for good quality food items increases with an increase in the level of income.
Solution 18
An inferior good is a good whose demand diminishes with a rise in the level of income and increases with a reduction in the income level. Individuals often tend to buy less inferior goods when their level of income rises. They tend to buy more inferior goods when there is a reduction in their income level.
There is a negative relationship between the level of income and the demand for inferior goods. For example, the demand for low-quality food items decreases with an increase in the level of income.
Solution 19
Goods and services which can be consumed instead of each other are called substitutes. People often tend to demand substitute goods when the price of one good increases.
For example, the demand for coffee increases because of a rise in the price of tea. The demand for Coca Cola tends to increase when there is an increase in the price of Pepsi.
Solution 20
Goods which are consumed altogether and cannot be consumed separately are regarded as complements. People often tend to buy complementary goods together. The demand for one complementary good is dependent on the price for another complementary good.
For example, fuel and cars. The demand for cars decreases because of an increase in the price of fuel. An increase in the price of sugar can lead to a decline in the demand for tea.
Solution 21
Price elasticity of demand is the percentage change in the quantity demanded for a good divided by the percentage change in the price of that particular good.
Price elasticity of demand indicates the responsiveness of the quantity demanded to changes in the price. The following formula is used to measure the price elasticity of demand:
![]()
Solution 22
Price elasticity of demand indicates the responsiveness of the quantity demanded to changes in the price. The following formula is used to measure the price elasticity of demand:
![]()
As given,
P = 4, Q = 25
P1 = 5 Q1 = 20


Percentage change in price = 25
Percentage change in quantity demanded = 20
Putting in formula,

Thus, the price elasticity of demand is 0.8.
Solution 23
As given,
Demand curve D (p) = 10 - 3p
Price = ![]()
The following formula can be used to compute elasticity:

Putting the values in the above formula,

Thus, the
elasticity of demand at price ![]() is -1.
is -1.
Solution 24
Percentage change in the price = 5%
Demand elasticity = -02
Putting in the formula of price elasticity of demand,

Thus, reduction in the demand for the good will be 1%.
Solution 25
Price elasticity of demand indicates the responsiveness of the quantity demanded to changes in the price. Following formula is used to measure the Price elasticity of demand.
![]()
As given,
Price elasticity of demand for a good= - 0.2
Rise in the price of a good=10%
The expenditure on the goods is likely to increase if there is 10% increase in the price of goods considering that the elasticity of demand is - 0.2. If the demand for goods is inelastic then a rise in the price will not change the demand.
People have to spend more on buying the goods if there is a 10% increase in the price of it. Inelasticity of demand forces people to spend comparatively more.
Thus, if there is a 10% increase in the price of the good, considering the price elasticity of demand is -0.2, the expenditure on the goods is likely to increase.
Solution 26
If there was a 4% decrease in the price of a good, and as a result, the expenditure on the good increased by 2%, then the elasticity of demand would be less than unitary elastic.
As given,
Change (decrease) in the price of a good = 4%
Change (increase) in the expenditure on the good = 2%
In this case, the
change (increase) in the expenditure on the good is less than that of the change
(decrease) in the price of a good. This indicates that the demand is
inelastic![]() .
.
