
Class 11-commerce NCERT Solutions Economics Chapter 6: Non-Competitive Markets
Non-Competitive Markets Exercise 100
Solution 1
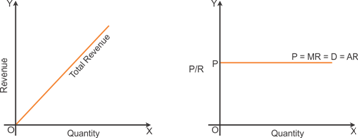
The shape of the demand curve would be horizontally parallel to the X-axis as indicated in the figure below.
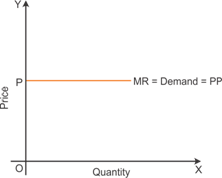
The figure shows the shape of the demand curve or AR. This curve also indicates that the marginal revenue and the demand are the same as price remains constant at all levels of output.
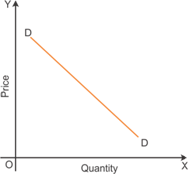
The demand curve would be downward sloping if a horizontal TR indicates that TR remains the same at all levels of output. It is possible only when the price falls with rise in output. The figure shows the shape of the demand curve. The demand curve is sloping downward from left to right.
Solution 2
Total revenue can be calculated by adding the given marginal revenue. The demand curve can be measured by considering the total revenue and the quantity.
|
Quantity |
Marginal Revenue |
Average Revenue |
Total Revenue |
Price Elasticity of Demand |
|
1 |
10 |
10 |
10 |
- |
|
2 |
6 |
8 |
16 |
5 |
|
3 |
2 |
6 |
18 |
2 |
|
4 |
2 |
54.5 |
20 |
2 |
|
5 |
2 |
4.5 |
22 |
2.5 |
|
6 |
0 |
3.6 |
22 |
1 |
|
7 |
0 |
3.1 |
22 |
1.2 |
|
8 |
0 |
2.7 |
22 |
1.1 |
|
9 |
-5 |
1.9 |
17 |
0.38 |
In the table, the price elasticity of demand is measured by considering the percentage change in price and the percentage change in demand.
Solution 3
The value of marginal revenue will be positive when the demand curve is elastic. The following is the graphical representation between the relationship between the value of MR and the demand curve.
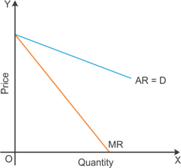
The figure indicates that the marginal revenue and average revenue curves are downward sloping from left to right.
Non-Competitive Markets Exercise 101
Solution 4
In the short run, the equilibrium price and the quantity is determined at a place where a firm earns maximum profit.
|
Quantity |
Price |
Total Revenue |
|
1 |
100 |
100 |
|
2 |
90 |
180 |
|
3 |
80 |
240 |
|
4 |
70 |
280 |
|
5 |
60 |
300 |
|
6 |
50 |
300 |
|
7 |
40 |
280 |
|
8 |
30 |
240 |
|
9 |
20 |
180 |
|
10 |
10 |
100 |
The table shows that at the 6th unit, a firm is maximising its profit. So, the equilibrium price is 50 and the equilibrium quantity is 300 as indicated in the table.
The cost of production in the short run is considered zero. So, the profit is calculated as below:

Thus, the profit is 300.
In the short run, the equilibrium quantity is determined at the level where the total revenue is maximum, i.e. 300 units.
Calculation of profit in the long run:

Thus, the profit in the long run is -700. This indicates that a firm is earning negative profits in the long run.
Solution 5
A monopolist firm will behave like a firm in a perfectly competitive market as it has to accept the price determined by the government.
The price set by the government establishes the equilibrium of market demand and market supply. The following is a graphical representation of the equilibrium price and the quantity.
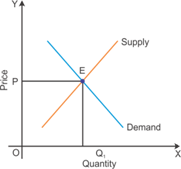
The figure shows that the equilibrium level is determined by the intersection of demand and supply.
Firms earn normal profit when the price is determined by the government or the price is determined by the market forces in the long run.
Solution 6
(i)
The shape of the marginal curve is horizontal when the total revenue curve is positive. The positive slope of the TR curve indicates that there is constant increase in the marginal revenue. The following is a graphical representation of the TR and MR curves.
The above TR curve is sloping upward from left to right. This is a positive slope of the TR curve. The shape of the MR curve is horizontal to the X axis.
(ii)
The shape of the marginal curve is horizontal and coincides with the quantity axis when the total revenue curve is a horizontal straight line. The horizontal straight line slope of the TR curve indicates that the marginal revenue is zero. The following is a graphical representation of the TR and MR curves.
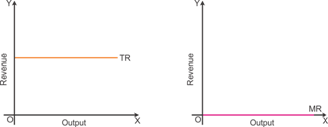
The figure indicates the shapes of the TR and MR curves. The MR curve coincides with the quantity axis because the marginal revenue is zero as indicated in the figures.
Solution 7
(a)
|
Quantity |
Price |
Total Revenue |
Marginal Revenue |
Marginal Cost |
Total Cost |
|
2 |
52 |
0 |
- |
- |
10 |
|
1 |
44 |
44 |
44 |
50 |
60 |
|
2 |
37 |
74 |
30 |
40 |
90 |
|
3 |
31 |
93 |
19 |
10 |
100 |
|
4 |
26 |
104 |
11 |
2 |
102 |
|
5 |
22 |
110 |
6 |
3 |
105 |
|
6 |
19 |
114 |
4 |
4 |
109 |
|
7 |
16 |
112 |
-2 |
6 |
115 |
|
8 |
13 |
104 |
-8 |
10 |
125 |
(b)
As indicated in the table, the marginal revenue and the marginal cost are equal at the quantity 6.
(c)
The equilibrium quantity is determined at the level where the marginal cost equals the marginal revenue. In the table, the marginal cost equals the marginal revenue at a quantity of 6 units. At this quantity, the market price is 19.
(d)
At the equilibrium level, the total revenue is 114 and the total cost is 109. The profit can be calculated by considering the total revenue and total cost.
Profit = Total revenue - Total cost
Profit = 114 - 109
Profit = 5
Thus, the profit is Rs 5.
Solution 8
A monopolist firm is likely to stop producing goods and services if the price declines below the minimum of the average variable cost.
If the price declines below the minimum of the average variable cost, then a monopolist firm has to incur huge losses. This enforces them to stop production.
If the price is between the average cost and the average variable cost, then a monopolist firm will continue its production.
Solution 9
The demand curve facing a firm under monopolistic competition is negatively sloped because of the following reasons:
- Firms in a monopolistically competitive market produce differentiated products.
- Products are close substitutes.
- Demand for products is elastic.
Normally, firms under monopolistic competition reduce the price for their goods and services aiming to increase sales. This causes a negative slope of the demand curve.
Solution 10
Because of the free entry and exit from the market, firms earn zero profit in the long run. If firms earn supernormal profits in the short run, then new firms enter the market. Because of the new entry of firms, market supply goes up and market price goes down.
If the price becomes equal to the minimum of average cost in the long run, then firms earn zero profit.
If firms incur huge losses in the short run, then firms will exit the market. This lowers market supply.
Decrease in the supply causes a rise in the price. The price becomes equal to the minimum of the average cost in the long run and the firm earns zero profit.
Solution 11
Ways in which oligopoly firms may behave:
Excessive advertisement and product differentiation: Firms in an oligopoly market try to increase their sale by excessive advertisement and product differentiation.
Most of the firms try to avoid price competition as it will lead to losses. So, they focus on product differentiation and advertisement of products.
Cartel: A cartel is a formal contract between firms in an oligopoly market. This contract helps the firms to avoid undue competition in the oligopoly market.
Informal understanding: Firms assume certain strategies of their opponents, while determining their own strategies.
Solution 12
As given,
Market demand curve ![]()
A duopolistic firm prefers to supply half of the market demand considering the straight line demand curve and the total cost being zero.
At zero price, the market demand is 200 units.
Firm 'A' faces a market demand of 200 units considering that Firm 'B' is not producing anything.
Thus, the goods supplied by Firm A 
Now, the market demand faced by Firm B = 100 (200 - 100)
The supply of Firm B = 
Firm B is supplying 50 units, so Firm A would face the demand for 150 units (200 - 50).
Supply of Firm A 
The following table indicates the quantity supplied by Firm A and Firm B.
|
Round |
Firms |
Quantity supplied |
|
1 |
B |
0 |
|
2 |
A |
|
|
3 |
B |
|
|
4 |
A |
|
|
5 |
B |
|


If we calculate the output supplied by Firm A, then it would be ![]() units. Firm B would supply the same output. Thus, the market supply would be
units. Firm B would supply the same output. Thus, the market supply would be ![]()
The equilibrium price can be calculated as below:

Thus, the equilibrium price would be ![]() .
.
Solution 13
Prices being rigid mean the unresponsiveness of the price with respect to changes in the demand. It indicates that the price does not change due to changes in the demand.
Some firms in an oligopoly market increase the price aiming to increase their profitability. Some other firms in the market do not increase the price fearing reduction in the demand. This behaviour causes a decline in the demand for the output of Firm A.
On the contrary, if a firm decreases its prices to increase its profit by selling more goods and services, then other firms in the market also try to reduce their prices. This will not have significant impacts on the market demand.
Thus, the oligopoly behaviour of not reacting to changes in price leads to a price rigidity outcome.