
Class 10 NCERT Solutions Maths Chapter 13 - Statistics
Statistics Exercise Ex. 13.1
Solution 1
Let us find class marks (xi) for each interval by using the relation. ![]()
Now we may compute xi and fixias following
| Number of plants | Number of houses (fi) | xi | fixi |
| 0 - 2 | 1 | 1 | 1— 1 = 1 |
| 2 - 4 | 2 | 3 | 2 — 3 = 6 |
| 4 - 6 | 1 | 5 | 1 — 5 = 5 |
| 6 - 8 | 5 | 7 | 5 — 7 = 35 |
| 8 - 10 | 6 | 9 | 6 — 9 = 54 |
| 10 - 12 | 2 | 11 | 2 —11 = 22 |
| 12 - 14 | 3 | 13 | 3 — 13 = 39 |
| Total | 20 | 162 |
From the table, we may observe that 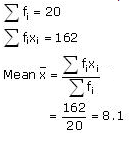
So, the mean number of plants per house is 8.1.
We have used here direct method as values of class marks (xi) and fi are small.
Solution 2
Let us find class mark for each interval by using the relation. ![]()
Class size (h) of this data = 20
Now taking 550 as assured mean (a) we may calculate di, ui and fiuias following.
| Daily wages (in Rs) | Number of workers (fi) | xi | di = xi - 550 |  |
fiui |
| 500 - 520 | 12 | 510 | - 40 | -2 | - 24 |
| 520 - 540 | 14 | 530 | - 20 | -1 | - 14 |
| 540 - 560 | 8 | 550 | 0 | 0 | 0 |
| 560 - 580 | 6 | 570 | 20 | 1 | 6 |
| 580 - 600 | 10 | 590 | 40 | 2 | 20 |
| Total | 50 | -12 |
From the table we may observe that 

So mean daily wages of the workers of the factory is Rs. 545.2.
Solution 3
We may find class mark (xi) for each interval by using the relation. ![]()
Given that mean pocket allowance  = Rs.18
Now taking 18 as assured mean (a) we may calculate di and fidias following.
| Daily pocket allowance (in Rs.) | Number of children fi | Class mark xi | di = xi - 18 | fidi |
| 11 - 13 | 7 | 12 | - 6 | - 42 |
| 13 - 15 | 6 | 14 | - 4 | - 24 |
| 15 - 17 | 9 | 16 | - 2 | - 18 |
| 17 - 19 | 13 | 18 | 0 | 0 |
| 19 - 21 | f | 20 | 2 | 2 f |
| 21 - 23 | 5 | 22 | 4 | 20 |
| 23 - 25 | 4 | 24 | 6 | 24 |
| Total |  |
2f - 40 |
From the table we may obtain 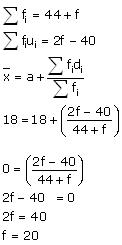
Hence the missing frequency f is 20.
Solution 4
We may find class mark of each interval (xi) by using the relation. ![]()
Class size h of this data = 3
Now taking 75.5 as assumed mean (a) we may calculate di, ui, fiui as following.
| Number of heart beats per minute | Number of women fi | xi | di = xi -75.5 |  |
fiui |
| 65 - 68 | 2 | 66.5 | - 9 | - 3 | - 6 |
| 68 - 71 | 4 | 69.5 | - 6 | - 2 | - 8 |
| 71 - 74 | 3 | 72.5 | - 3 | - 1 | - 3 |
| 74 - 77 | 8 | 75.5 | 0 | 0 | 0 |
| 77 - 80 | 7 | 78.5 | 3 | 1 | 7 |
| 80 - 83 | 4 | 81.5 | 6 | 2 | 8 |
| 83 - 86 | 2 | 84.5 | 9 | 3 | 6 |
| Total | 30 | 4 |
Now we may observe from table that 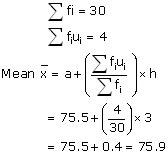
So mean heart beats per minute for these women are 75.9 beats per minute.
Solution 5
| Number of mangoes | Number of boxes fi |
| 50 - 52 | 15 |
| 53 - 55 | 110 |
| 56 - 58 | 135 |
| 59 - 61 | 115 |
| 62 - 64 | 25 |
We may observe that class intervals are not continuous. There is a gap of 1 between two class intervals. So we have to add  to upper class limit and subtract from lower class limit of each interval.
And class mark (xi) may be obtained by using the relation ![]()
Class size (h) of this data = 3
Now taking 57 as assumed mean (a) we may calculate di, ui, fiui as following -
| Class interval | fi | xi | di = xi - 57 |  |
fiui |
| 49.5 - 52.5 | 15 | 51 | -6 | -2 | -30 |
| 52.5 - 55.5 | 110 | 54 | -3 | -1 | -110 |
| 55.5 - 58.5 | 135 | 57 | 0 | 0 | 0 |
| 58.5 - 61.5 | 115 | 60 | 3 | 1 | 115 |
| 61.5 - 64.5 | 25 | 63 | 6 | 2 | 50 |
| Total | 400 | 25 |
Now we may observe that
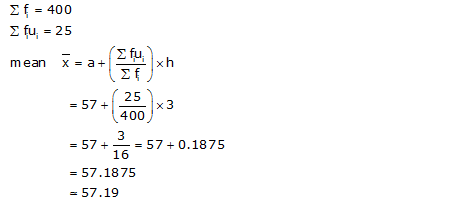
Clearly, mean number of mangoes kept in a packing box is 57.19.
We have chosen step deviation method here as values of fi, di are big and also there is a common multiple between all di.
Solution 6
We may calculate class mark (xi) for each interval by using the relation
![]()
Class size = 50
Now taking 225 as assumed mean (a) we may calculate di, ui, fiui as following
| Daily expenditure (in Rs) | fi | xi | di = xi - 225 |  |
fiui |
| 100 - 150 | 4 | 125 | -100 | -2 | -8 |
| 150 - 200 | 5 | 175 | -50 | -1 | -5 |
| 200 - 250 | 12 | 225 | 0 | 0 | 0 |
| 250 - 300 | 2 | 275 | 50 | 1 | 2 |
| 300 - 350 | 2 | 325 | 100 | 2 | 4 |
| Total | 25 | -7 |
Now we may observe that - 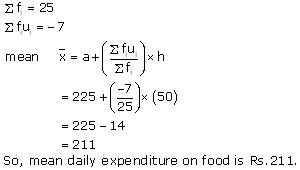
Solution 7
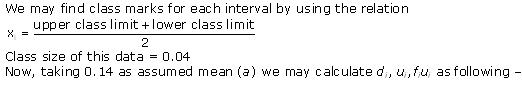
| Concentration of SO2 (in ppm) | Frequency | Class mark xi | di = xi - 0.14 |  |
fiui |
| 0.00 - 0.04 | 4 | 0.02 | -0.12 | -3 | -12 |
| 0.04 - 0.08 | 9 | 0.06 | -0.08 | -2 | -18 |
| 0.08 - 0.12 | 9 | 0.10 | -0.04 | -1 | -9 |
| 0.12 - 0.16 | 2 | 0.14 | 0 | 0 | 0 |
| 0.16 - 0.20 | 4 | 0.18 | 0.04 | 1 | 4 |
| 0.20 - 0.24 | 2 | 0.22 | 0.08 | 2 | 4 |
| Total | 30 | -31 |

Solution 8
We may find class mark of each interval by using the relation

Now taking 16 as assumed mean (a) we may calculate di and fidi as following
Number of days |
Number of students fi |
xi |
di= xi - 16 |
fidi |
0 - 6 |
11 |
3 |
-13 |
-143 |
6 -10 |
10 |
8 |
-8 |
-80 |
10 - 14 |
7 |
12 |
-4 |
-28 |
14 - 20 |
4 |
16 |
0 |
0 |
20 - 28 |
4 |
24 |
8 |
32 |
28 - 38 |
3 |
33 |
17 |
51 |
38 - 40 |
1 |
39 |
23 |
23 |
Total |
40 |
-145 |
Now we may observe that
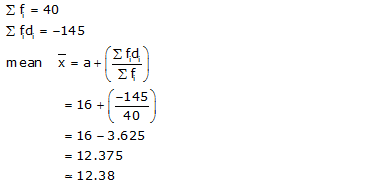
So, mean number of days is 12.38 days, for which a student was absent.
Solution 9
We may find class marks by using the relation

Class size (h) for this data = 10
Now taking 70 as assumed mean (a) we may calculate di, ui, and fiui as following
Literacy rate (in %) |
Number of cities fi |
xi |
di= xi - 70 |
 |
fiui |
45 - 55 |
|
50 |
-20 |
-2 |
-6 |
55 - 65 |
10 |
60 |
-10 |
-1 |
-10 |
65 - 75 |
11 |
70 |
0 |
0 |
0 |
75 - 85 |
8 |
80 |
10 |
1 |
|
85 - 95 |
3 |
90 |
20 |
2 |
6 |
Total |
35 |
-2 |
Now we may observe that 
So, the mean literacy rate is 69.43%.
Statistics Exercise Ex. 13.2
Solution 1
We may compute class marks (xi) as per the relation

Now taking 30 as assumed mean (a) we may calculate di and fidi as following.
Age (in years) |
Number of patients fi |
class mark xi |
di= xi - 30 |
fidi |
5 - 15 |
6 |
10 |
-20 |
-120 |
15 - 25 |
11 |
20 |
-10 |
-110 |
25 - 35 |
21 |
30 |
0 |
0 |
35 - 45 |
23 |
40 |
10 |
230 |
45 - 55 |
14 |
50 |
20 |
280 |
55 - 65 |
5 |
60 |
30 |
150 |
Total |
80 |
430 |
From the table we may observe that 
Clearly, mean of this data is 35.38. It represents that on an average the age of a patient admitted to hospital was 35.38 years.
As we may observe that maximum class frequency is 23 belonging to class interval 35 - 45.
So, modal class = 35 - 45
Lower limit (l) of modal class = 35
Frequency (f1) of modal class = 23
Class size (h) = 10
Frequency (f0) of class preceding the modal class = 21
Frequency (f2) of class succeeding the modal class = 14 
Clearly mode is 36.8.It represents that maximum number of patients admitted in hospital were of 36.8 years.
Solution 2
From the data given as above we may observe that maximum class frequency is 61 belonging to class interval 60 - 80.
So, modal class = 60 - 80
Lower class limit (l) of modal class = 60
Frequency (f1) of modal class = 61
Frequency (f0) of class preceding the modal class = 52
Frequency (f2) of class succeeding the modal class = 38
Class size (h) = 20 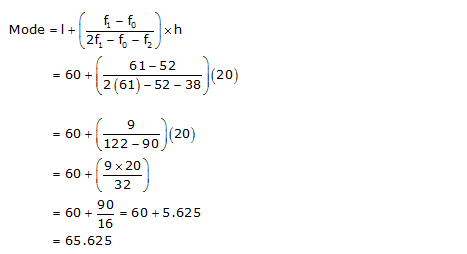
So, modal lifetime of electrical components is 65.625 hours.
Solution 3
We may observe from the given data that maximum class frequency is 40 belonging to 1500 - 2000 intervals.
So, modal class = 1500 - 2000
Lower limit (l) of modal class = 1500
Frequency (f1) of modal class = 40
Frequency (f0) of class preceding modal class = 24
Frequency (f2) of class succeeding modal class = 33
Class size (h) = 500 
Now we may find classmark as 
Class size (h) of give data = 500
Now taking 2750 as assumed mean (a) we may calculate di, ui and fiui as following
Expenditure (in Rs) |
Number of families fi |
xi |
di = xi - 2750 |
 |
fiui
|
1000 - 1500 |
24 |
1250 |
-1500 |
-3 |
-72 |
1500 - 2000 |
40 |
1750 |
-1000 |
-2 |
-80 |
2000 - 2500 |
33 |
2250 |
-500 |
-1 |
-33 |
2500 - 3000 |
28 |
2750 |
0 |
0 |
0 |
3000 - 3500 |
30 |
3250 |
500 |
1 |
30 |
3500 - 4000 |
22 |
3750 |
1000 |
2 |
44 |
4000 - 4500 |
16 |
4250 |
1500 |
3 |
48 |
4500 - 5000 |
7 |
4750 |
2000 |
4 |
28 |
Total |
200 |
-35 |
Now from the table, we may observe that

So, mean monthly expenditure was Rs.2662.50.
Solution 4
We may observe from the given data that maximum class frequency is 10 belonging to class interval 30 - 35.
So, modal class = 30 - 35
Class size (h) = 5
Lower limit (l) of modal class = 30
Frequency (f1) of modal class = 10
Frequency (f0) of class preceding modal class = 9
Frequency (f2) of class succeeding modal class = 3 
It represents that most of states/U.T have a teacher student ratio as 30.6
Now we may find class marks by using the relation 
Now taking 32.5 as assumed mean (a) we may calculate di, ui and fiui as following.
Number of students per teacher |
Number of states/U.T (fi) |
xi |
di = xi - 32.5 |
|
fiui |
15 - 20 |
3 |
17.5 |
-15 |
-3 |
-9 |
20 - 25 |
8 |
22.5 |
-10 |
-2 |
-16 |
25 - 30 |
9 |
27.5 |
-5 |
-1 |
-9 |
30 - 35 |
10 |
32.5 |
0 |
0 |
0 |
35 - 40 |
3 |
37.5 |
5 |
1 |
3 |
40 - 45 |
0 |
42.5 |
10 |
2 |
0 |
45 - 50 |
0 |
47.5 |
15 |
3 |
0 |
50 - 55 |
2 |
52.5 |
20 |
4
|
8 |
Total |
35
|
-23 |


So mean of data is 29.2
It represents that an average teacher-student ratio was 29.2.
Solution 5
From the given data we may observe that maximum class frequency is 18 belonging to class interval 4000 - 5000.
So, modal class = 4000 - 5000
Lower limit (l) of modal class = 4000
Frequency (f1) of modal class = 18
Frequency (f0) of class preceding modal class = 4
Frequency (f2) of class succeeding modal class = 9
Class size (h) = 1000 
So mode of given data is 4608.7 runs.
Solution 6
From the given data we may observe that maximum class frequency is 20 belonging to 40 - 50 class intervals.
So, modal class = 40 - 50
Lower limit (l) of modal class = 40
Frequency (f1) of modal class = 20
Frequency (f0) of class preceding modal class = 12
Frequency (f2) of class succeeding modal class = 11
Class size = 10 
So mode of this data is 44.7 cars.
Statistics Exercise Ex. 13.3
Solution 1
We may find class marks by using the relation 
Taking 135 as assumed mean (a) we may find di, ui, fiui, according to step deviation method as following
Monthly consumption (in units) |
Number of consumers (f i) |
xi class mark |
di = xi - 135
|
 |
fiui |
65 - 85 |
4 |
|
- 60 |
- 3 |
- 12 |
85 - 105 |
5 |
95 |
- 40 |
- 2 |
- 10 |
105 - 125 |
13 |
115 |
- 20 |
- 1 |
- 13 |
125 - 145 |
20 |
135 |
0 |
0 |
0 |
145 - 165 |
14 |
155 |
20 |
|
14 |
165 - 185 |
8 |
175 |
40 |
2 |
16 |
185 - 205 |
4 |
195 |
60 |
3 |
12 |
Total |
68 |
7 |
From the table we may observe that 
Now from table it is clear that maximum class frequency is 20 belonging to class interval 125 - 145.
Modal class = 125 - 145
Lower limit (l) of modal class = 125
Class size (h) = 20
Frequency (f1) of modal class = 20
Frequency (f0) of class preceding modal class = 13
Frequency (f2) of class succeeding the modal class = 14 
We know that
3 median = mode + 2 mean
= 135.76 + 2 (137.058)
= 135.76 + 274.116
= 409.876
Median = 136.625
So median, mode, mean of given data is 136.625, 135.76, 137.05 respectively.
Solution 2
We may find cumulative frequency for the given data as following
Class interval |
Frequency |
Cumulative frequency |
0 - 10 |
5 |
5 |
10 - 20 |
x |
5 + x |
20 - 30 |
20 |
25 + x |
30 - 40 |
15 |
40 + x |
40 - 5 |
y |
40 + x + y |
50 - 60 |
5 |
45 + x + y |
Total (n) |
60 |
It is clear that n = 60
45 + x + y = 60
x + y = 15 (1)
Median of data is given as 28.5 which lies in interval 20 - 30.
So, median class = 20 - 30
Lower limit (l) of median class = 20
Cumulative frequency (cf) of class preceding the median class = 5 + x
Frequency (f) of median class = 20
Class size (h) = 10 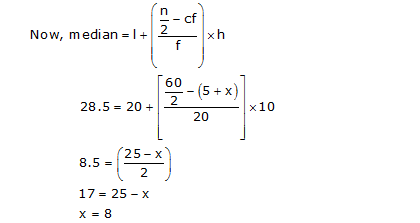
From equation (1)
8 + y = 15
y = 7
Hence values of x and y are 8 and 7 respectively.
Solution 3
Here the class width is not the same. There is no need to adjust the frequencies according to class intervals. Now given frequency table is of less than type represented with upper-class limits. As policies were given only to persons having age 18 years onwards but less than 60 years, we can define class intervals with their respective cumulative frequency as below
Age (in years) |
Number of policyholders (fi) |
Cumulative frequency (cf) |
18 - 20 |
2 |
2 |
20 - 25 |
6 - 2 = 4 |
6 |
25 - 30 |
24 - 6 = 18 |
24 |
30 - 35 |
45 - 24 = 21 |
45 |
35 - 40 |
78 - 45 = 33 |
78 |
40 - 45 |
89 - 78 = 11 |
89 |
45 - 50 |
92 - 89 = 3 |
92 |
50 - 55 |
98 - 92 = 6 |
98 |
55 - 60 |
100 - 98 = 2 |
100 |
Total (n) |
|
Now from the table we may observe that n = 100.
Cumulative frequency (cf) just greater than  is 78 belonging to interval 35 - 40
So, median class = 35 - 40
Lower limit (l) of median class = 35
Class size (h) = 5
Frequency (f) of median class = 33
Cumulative frequency (cf) of class preceding median class = 45 
So, the median age is 35.76 years.
Solution 4
The given data is not having continuous class intervals. We can observe that the difference between the two class intervals is 1. So, we have to add and subtract
 to upper-class limits and lower class limits.
Now continuous class intervals with respective cumulative frequencies can be represented as below
Length (in mm) |
Number or leaves fi |
Cumulative frequency |
117.5 - 126.5 |
3 |
3 |
126.5 - 135.5 |
5 |
3 + 5 = 8 |
135.5 - 144.5 |
9
|
8 + 9 = 17 |
144.5 - 153.5 |
12 |
17 + 12 = 29 |
153.5 - 162.5 |
5
|
29 + 5 = 34 |
162.5 - 171.5 |
4 |
34 + 4 = 38 |
171.5 - 180.5 |
2 |
38 + 2 = 40 |
From the table, we may observe that cumulative frequency just greater than  is 29, belonging to class interval 144.5 - 153.5.
Median class = 144.5 - 153.5
Lower limit (l) of median class = 144.5
Class size (h) = 9
Frequency (f) of median class = 12
Cumulative frequency (cf) of class preceding median class = 17

So, the median length of leaves is 146.75 mm.
Solution 5
We can find cumulative frequencies with their respective class intervals as below -
Life time |
Number of lamps (fi) |
Cumulative frequency |
1500 - 2000 |
14 |
14 |
2000 - 2500 |
56 |
14 + 56 = 70 |
2500 - 3000 |
60 |
70 + 60 = 130 |
3000 - 3500 |
86 |
130 + 86 = 216 |
3500 - 4000 |
74 |
216 + 74 = 290 |
4000 - 4500 |
62 |
290 + 62 = 352 |
4500 - 5000 |
48 |
352 + 48 = 400 |
Total (n) |
400 |
Now we may observe that cumulative frequency just greater than  is 216 belonging to class interval 3000 - 3500.
Median class = 3000 - 3500
Lower limit (l) of median class = 3000
Frequency (f) of median class = 86
Cumulative frequency (cf) of class preceding median class = 130
Class size (h) = 500 
So, the median lifetime of lamps is 3406.98 hours.
Solution 6
We can find cumulative frequencies with their respective class intervals as below
Number of letters |
Frequency (fi)
|
Cumulative frequency |
1 - 4 |
6 |
6 |
4 - 7 |
30 |
30 + 6 = 36 |
7 - 10 |
40 |
36 + 40 = 76 |
10 - 13 |
16 |
76 + 16 = 92 |
13 - 16 |
4 |
92 + 4 = 96 |
16 - 19 |
4 |
96 + 4 = 100 |
Total (n) |
100 |
Now we may observe that cumulative frequency just greater than  is 76 belonging to the class interval 7 - 10.
Median class = 7 - 10
Lower limit (l) of median class = 7
Cumulative frequency (cf) of class preceding median class = 36
Frequency (f) of median class = 40
Class size (h) = 3 
Now we can find class marks of given class intervals by using relation 
Taking 11.5 as assumed mean (a) we can find di, ui and fiui according to step deviation method as below.
Number of letters |
Number of surnames |
xi |
xi - a |
 |
fiui |
1 - 4 |
6 |
2.5 |
-9 |
-3 |
-18 |
4 - 7 |
30 |
5.5 |
-6 |
-2 |
-60 |
7 - 10 |
40 |
8.5 |
-3 |
-1 |
-40 |
10 - 13 |
16 |
11.5 |
0 |
0 |
0 |
13 - 16 |
4 |
14.5 |
3 |
1 |
4 |
16 - 19 |
4 |
17.5 |
6 |
2 |
8 |
Total |
100 |
-106 |
 fiui = - 106fi = 100
We know that
3 median = mode + 2 mean
3(8.05) = mode + 2(8.32)
24.15 - 16.64 = mode
7.51 = mode
So, median number and mean number of letters in surnames is 8.05 and 8.32 respectively while modal size of surnames is 7.51.
Solution 7
We may find cumulative frequencies with their respective class intervals as below
| Weight (in kg) | No. of students | Cumulative frequency (c.f) |
| 40 - 45 | 2 | 2 |
| 45 - 50 | 3 | 2+3=5 |
| 50 - 55 | 8 | 5+8=13 |
| 55 - 60 | 6 | 13+6=19 |
| 60 - 65 | 6 | 19+6=25 |
| 65 - 70 | 3 | 25+3=28 |
| 70 - 75 | 2 |
28+2=30 |
Total = 30
Cumulative frequency just greater than  is 19, belonging to class interval 55 - 60.
Median class = 55 - 60
Lower limit (l) of median class = 55
Frequency (f) of median class = 6
Cumulative frequency (cf) of class preceeding the median class = 13
Class size (h) = 5 
So, the median weight is 56.67 kg.
