
Class 9 MAHARASHTRA STATE TEXTBOOK BUREAU Solutions Social Studies Chapter 1 - Distributional Maps
Distributional Maps Exercise 7
Solution 1(1)
Wrong. The distributional maps are thematic maps. Their main aim is to show the distribution of variables like temperature, rainfall, population, etc.
Solution 1(2)
True. In choropleth maps, only one value is given to one sub administrative unit in a region. In this method, the data regarding various geographical variables is shown by shading or using tints of various colours.
Solution 1(3)
Wrong. In choropleth maps, colours/tints change according to the values of variables. The shades of the colour becomes darker with the increasing values of the given variable.
Solution 1(4)
Wrong. Isopleth maps are used to show altitude.
Solution 1(5)
Wrong. Choropleth maps or the dot method maps are used to show population distribution.
Solution 1(6)
Right. The size of the dot is decided as per the value of a variable that is freely scattered across the region.
Solution 1(7)
Wrong. Isopleth maps are made using isolines.
Solution 1(8)
Wrong. Distribution of geographical elements which are freely scattered across a region can be shown using a dot method. Whereas the distribution of variables like rainfall, altitude, temperature etc. which are continuous, cannot be shown using a dot method map.
Solution 2(1)
Thematic maps show the distribution of temperature, rainfall, population etc. Distributional maps explain the distribution of variables according to the data.
There are three types of distributional maps. These are:
- Dot method: A dot map is prepared using statistical data. In this method, only data gathered through counting is used. The dots are used to show the distribution of variables on the map. For example dot method is used to show the distribution of population on the map.
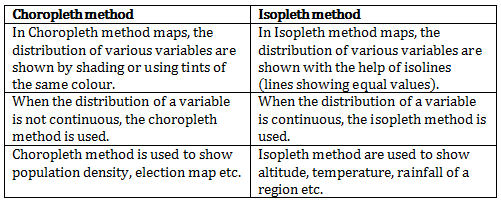
- Choropleth method: Data is obtained through various processes such as through measurement and surveying. In this method, the data regarding variables is shown by shades or tints of various colours.
- Isopleth method: In isopleth method, the distribution of variables is shown with the help of lines showing equal values. Altitude, rainfall and temperature are shown with the help of isopleth method. We need to have an accurate data.
Solution 2(2)
Solution 2(3)
The dot method is best suited to show the distribution of population in a region. It is because population is freely scattered across the regions and the dot method is most suitable to show freely scattered variables. The dots used in this method, are given a particular value which is determined by selecting a proper scale considering the spread of the values of the variables in the given region.
Solution 3(1)
Dot method
Solution 3(2)
Isopleth method
Distributional Maps Exercise 8
Solution 3(3)
Dot method
Solution 3(4)
Choropleth method
Solution 3(5)
Isopleth method
Solution 4
- The dot method has been used to show the distribution of population in the district.
- The distribution of population is dense in the west while it is sparse in the east.
- The population shown by the largest circle is nearly 20 lakhs. That place is Kolhapur city in Karvir Taluka.
- Gaganbavada Taluka has the least population.
