
CBSE Class 6 Answered
Here is a pictograph of how many apples were sold at the local shop over 4 months: 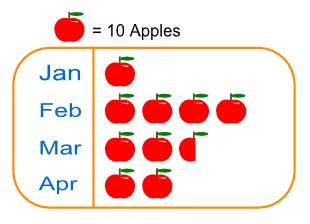 Study the graph and answer the questions: (a) Number of apples sold in the month of March. (b) Number of apples sold in the month of April.
Study the graph and answer the questions: (a) Number of apples sold in the month of March. (b) Number of apples sold in the month of April.
Asked by Topperlearning User | 04 Jun, 2014, 01:23: PM
Since one apple represents 10 apples, therefore
(a) Number of apples sold in the month of March
= 10 + 10 + 5 = 25
(b) Number of apples sold in the month of April = 10 + 10 = 20.
(a) Number of apples sold in the month of March
= 10 + 10 + 5 = 25
(b) Number of apples sold in the month of April = 10 + 10 = 20.
Answered by | 04 Jun, 2014, 03:23: PM
Concept Videos

CBSE 6 - Maths
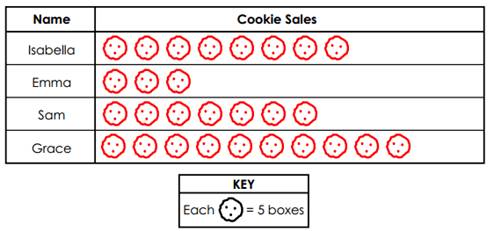 (a) Number of boxes sold by Sam. (b) Number of boxes sold by Emma.
Asked by Topperlearning User | 30 Apr, 2015, 10:26: AM
CBSE 6 - Maths
Asked by Topperlearning User | 04 Jun, 2014, 01:23: PM
CBSE 6 - Maths
Asked by Topperlearning User | 30 Apr, 2015, 10:15: AM
CBSE 6 - Maths
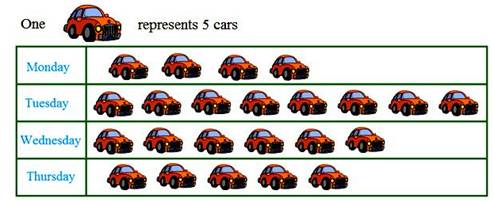 Read the graph and answer the questions: (a) Number of cars sold on Monday. (b) On which day minimum sale happened?
Asked by Topperlearning User | 10 Jul, 2014, 10:50: AM
CBSE 6 - Maths
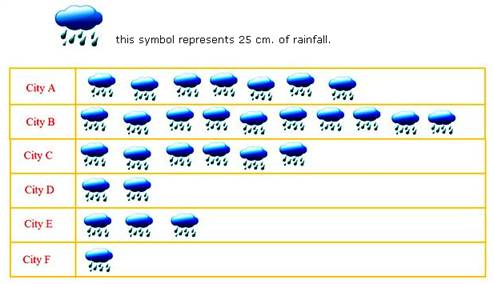 1. In which city did maximum rainfall occur?2. In which city did minimum rainfall occur?3. The city A recorded how much more rainfall than the city F.
Asked by Topperlearning User | 30 Apr, 2015, 10:25: AM
CBSE 6 - Maths
Asked by Topperlearning User | 30 Apr, 2015, 10:11: AM
CBSE 6 - Maths
Asked by Topperlearning User | 30 Apr, 2015, 10:18: AM
CBSE 6 - Maths
Asked by Topperlearning User | 04 Jun, 2014, 01:23: PM
