Please wait...
Contact Us
Contact
Need assistance? Contact us on below numbers

For Study plan details

10:00 AM to 7:00 PM IST all days.

For Franchisee Enquiry

OR

or

Thanks, You will receive a call shortly.
Customer Support

You are very important to us

For any content/service related issues please contact on this number

93219 24448 / 99871 78554

Mon to Sat - 10 AM to 7 PM

Ask Some Common Linear Graphs question free ×

Queries asked on Sunday and after 7 pm from Monday to Saturday will be answered after 12 pm the next working day.

  • CBSE×
  • Class 8×
  • Mathematics×
  • Introduction To Graphs×
  • Some Common Linear Graphs×

Some Common Linear Graphs Free Doubts and Solutions

CBSE - VIII - Maths - Introduction to Graphs

plkz nj
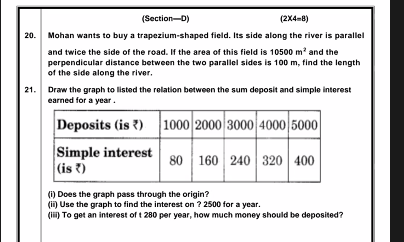
qsnImg
Asked by saifi.diagnostic 13th March 2021, 12:59 PM
Answer this question

Answer this question

×
Your answer has been posted successfully!

CBSE - VIII - Maths - Introduction to Graphs

What is a line graph ? What are the types of line grapes?

Asked by krushnagavande1978 18th September 2019, 6:56 PM
Answered by Expert

Answer this question

×
Your answer has been posted successfully!

CBSE - VIII - Maths - Introduction to Graphs

Plot the graph for the following table and check whether it is a linear graph or not. x 2 4 6 8 y 12 24 36 48

Asked by Topperlearning User 4th June 2014, 1:23 PM
Answered by Expert

Answer this question

×
Your answer has been posted successfully!

CBSE - VIII - Maths - Introduction to Graphs

Following table shows the relation between number of books sold and the profit earned on it. Number of books sold 3 6 15 Profit earned (in Rs) 15 30 75 Draw the graph for above data and find the profit earned if 12 books are sold.

Asked by Topperlearning User 4th June 2014, 1:23 PM
Answered by Expert

Answer this question

×
Your answer has been posted successfully!

CBSE - VIII - Maths - Introduction to Graphs

Two quantities x and y are related by the relation y = 5x + 3. Make a point table for 4 different values of x.

Asked by Topperlearning User 4th June 2014, 1:23 PM
Answered by Expert

Answer this question

×
Your answer has been posted successfully!

CBSE - VIII - Maths - Introduction to Graphs

Using a convenient scale plot the points for the multiples of 3.

Asked by Topperlearning User 4th June 2014, 1:23 PM
Answered by Expert

Answer this question

×
Your answer has been posted successfully!

CBSE - VIII - Maths - Introduction to Graphs

Plot the graph for the following table and check whether it is a linear graph or not. X 3 5 7 9 y 12 20 40 36

Asked by Topperlearning User 4th June 2014, 1:23 PM
Answered by Expert

Answer this question

×
Your answer has been posted successfully!

CBSE - VIII - Maths - Introduction to Graphs

A metal piece is heated and its temperature is noted at different intervals and recorded in a tabular form. Time (in sec.) 2 6 10 14 Temperature (in oC) 19 27 35 43  Represent this table in the form of a graph.

Asked by Topperlearning User 4th June 2014, 1:23 PM
Answered by Expert

Answer this question

×
Your answer has been posted successfully!

CBSE - VIII - Maths - Introduction to Graphs

The following table shows the relation between side and the perimeter of a square. Side (in cm) 2 4 6 8 10 Perimeter (in cm) 8 16 24 32 40 Represent this table in the form of a graph.

Asked by Topperlearning User 4th June 2014, 1:23 PM
Answered by Expert

Answer this question

×
Your answer has been posted successfully!

CBSE - VIII - Maths - Introduction to Graphs

A bank gives 10% simple interest on the deposits. Draw a graph to show the relation between the sum deposited and the simple interest earned.

Asked by Topperlearning User 4th June 2014, 1:23 PM
Answered by Expert

Answer this question

×
Your answer has been posted successfully!

CBSE - VIII - Maths - Introduction to Graphs

Following table shows the relation between number of balls and their cost. Number of balls 5 10 20 Cost (in Rs) 15 30 60 Draw the graph for above data and hence find the cost of 15 balls.

Asked by Topperlearning User 13th December 2013, 3:12 AM
Answered by Expert

Answer this question

×
Your answer has been posted successfully!

CBSE - VIII - Maths - Introduction to Graphs

The following graph shows the relation between time and distance. Study the graph and answer the following questions. (a) Find the distance covered in 80 seconds. (b) The distance 5000 m is covered in what time?

Asked by Topperlearning User 12th December 2013, 1:39 AM
Answered by Expert

Answer this question

×
Your answer has been posted successfully!

Latest Questions

Chat with us on WhatsApp