
Class 10 SELINA Solutions Maths Chapter 24 - Measures of Central Tendency (Mean, Median, Quartiles and Mode)
Measures of Central Tendency (Mean, Median, Quartiles and Mode) Exercise Ex. 24(A)
Solution 2
(a) Here n = 9

(b)
If marks of each student be increased by 4 then new arithmetic mean will be = 59 + 4 = 63
Solution 3
(a) The mean of 7, 11, 6, 5 and 6
![]()
(b)
If we subtract 2 from each number, then the mean will be 7-2 = 5
Solution 4
No. of terms = 5
Mean = 8
Sum of numbers = 8 x 5 = 40 .(i)
But, sum of numbers = 6+4+7+a+10 = 27+a ..(ii)
From (i) and (ii)
27+a = 40
a = 13
Solution 5
No. of terms = 5 and mean = 8
Sum of numbers = 5 x 8 = 40 ..(i)
but sum of numbers = 6+y+7+x+14 = 27+y+x .(ii)
from (i) and (ii)
27 + y + x = 40
x + y = 13
y = 13 - x
Solution 6
|
Age in yrs xi |
Frequency (fi) |
fixi |
|
12 |
2 |
24 |
|
13 |
4 |
52 |
|
14 |
6 |
84 |
|
15 |
9 |
135 |
|
16 |
8 |
128 |
|
17 |
7 |
119 |
|
18 |
4 |
72 |
|
Total |
40 |
614 |

Solution 7
No. of terms = 10
Mean = 69.5
Sum of the numbers = 69.5 x 10 = 695 ..........(i)
But sum of numbers = 72+70+x+62+ 50+71+90+64+58+82
= 619 + x ......(ii)
from (i) and (ii)
619 + x = 695
x = 76
Solution 8
|
Height (cm) xi |
No. of Plants fi |
fixi |
|
50 |
2 |
100 |
|
55 |
4 |
220 |
|
58 |
10 |
580 |
|
60 |
f |
60f |
|
65 |
5 |
325 |
|
70 |
4 |
280 |
|
71 |
3 |
213 |
|
Total |
28+f |
1718 + 60f |
Mean = 60.95

Solution 9
|
Wages (Rs/day) (x) |
No. of Workers (f) |
fx |
|
50 |
2 |
100 |
|
60 |
4 |
240 |
|
70 |
8 |
560 |
|
80 |
12 |
960 |
|
90 |
10 |
900 |
|
100 |
6 |
600 |
|
Total |
42 |
3360 |

(i) Mean remains the same if the number of workers in each category is doubled.
Mean = 80
(ii) Mean will be increased by 60% if the wages per day per worker is increased by 60%
New mean = ![]()
(iii) No change in the mean if the number of workers is doubled but if wages per worker is reduced by 40%, then
New mean = ![]()
Solution 10
|
No. of matches (x) |
No. of boxes (f) |
fx |
|
35 |
6 |
210 |
|
36 |
10 |
360 |
|
37 |
18 |
666 |
|
38 |
25 |
950 |
|
39 |
21 |
819 |
|
40 |
12 |
480 |
|
41 |
8 |
328 |
|
Total |
100 |
3813 |
(i) 
(ii) In the second case,
New mean = 39 matches
Total contents = 39 x 100 = 3900
But total number of matches already given = 3813
Number of new matches to be added = 3900 - 3813 = 87
Solution 11

Solution 12

Solution 13

Solution 14

Measures of Central Tendency (Mean, Median, Quartiles and Mode) Exercise Ex. 24(B)
Solution 2
|
Age in years C.I. |
xi |
Number of students (fi) |
xifi |
|
16 - 18 |
17 |
2 |
34 |
|
18 - 20 |
19 |
7 |
133 |
|
20 - 22 |
21 |
21 |
441 |
|
22 - 24 |
23 |
17 |
391 |
|
24 - 26 |
25 |
3 |
75 |
|
Total |
50 |
1074 |

Solution 3
(i) Short - cut method
|
Marks |
No. of boys (fi) |
Mid-value xi |
A = 65 di=x-A |
fidi |
|
30 - 40 |
10 |
35 |
-30 |
-300 |
|
40 - 50 |
12 |
45 |
-20 |
-240 |
|
50 - 60 |
14 |
55 |
-10 |
-140 |
|
60 - 70 |
12 |
A = 65 |
0 |
0 |
|
70 - 80 |
9 |
75 |
10 |
90 |
|
80 - 90 |
7 |
85 |
20 |
140 |
|
90 - 100 |
6 |
95 |
30 |
180 |
|
Total |
70 |
|
|
-270 |

(ii) Step - deviation method
|
Marks |
No. of boys (fi) |
Mid-value xi |
A = 65
|
fiui |
|
30 - 40 |
10 |
35 |
-3 |
-30 |
|
40 - 50 |
12 |
45 |
-2 |
-24 |
|
50 - 60 |
14 |
55 |
-1 |
-14 |
|
60 - 70 |
12 |
A = 65 |
0 |
0 |
|
70 - 80 |
9 |
75 |
1 |
9 |
|
80 - 90 |
7 |
85 |
2 |
14 |
|
90 - 100 |
6 |
95 |
3 |
18 |
|
Total |
70 |
|
|
-27 |

Here A = 65 and h = 10

Solution 4
|
C. I. |
Frequency (fi) |
Mid-value xi |
A = 87.50
|
fiui |
|
63 - 70 |
9 |
66.50 |
-3 |
-27 |
|
70 - 77 |
13 |
73.50 |
-2 |
-26 |
|
77 - 84 |
27 |
80.50 |
-1 |
-27 |
|
84 - 91 |
38 |
A = 87.50 |
0 |
0 |
|
91 - 98 |
32 |
94.50 |
1 |
32 |
|
98 - 105 |
16 |
101.50 |
2 |
32 |
|
105 - 112 |
15 |
108.50 |
3 |
45 |
|
Total |
150 |
|
|
29 |

Here A = 87.50 and h = 7

Solution 5
![]()
|
C. I. |
frequency |
Mid-value (xi) |
fixi |
|
0-10 |
8 |
5 |
40 |
|
10-20 |
22 |
15 |
330 |
|
20-30 |
31 |
25 |
775 |
|
30-40 |
f |
35 |
35f |
|
40-50 |
2 |
45 |
90 |
|
Total |
63+f |
|
1235+35f |

Solution 6
|
C.I. |
Frequency |
Mid value x |
fx |
|
15-25 |
10 |
20 |
200 |
|
25-35 |
20 |
30 |
600 |
|
35-45 |
25 |
40 |
1000 |
|
45-55 |
15 |
50 |
750 |
|
55-65 |
5 |
60 |
300 |
|
Total |
75 |
2850 |

Solution 7
|
Class |
Frequency (f) |
Mid Value (x) |
fx |
|
0 - 20 |
7 |
10 |
70 |
|
20 - 40 |
p |
30 |
30p |
|
40 - 60 |
10 |
50 |
500 |
|
60 - 80 |
9 |
70 |
630 |
|
80 - 100 |
13 |
90 |
1170 |
|
Total |
39 + p |
2370 + 30p |

Here mean = 54 ..(ii)
from (i) and (ii)

Solution 8
|
Class |
Freq (f) |
Mid value |
fx |
|
0-20 |
5 |
10 |
50 |
|
20-40 |
f1 |
30 |
30f1 |
|
40-60 |
10 |
50 |
500 |
|
60-80 |
f2 |
70 |
70f2 |
|
80-100 |
7 |
90 |
630 |
|
100-120 |
8 |
110 |
880 |
|
Total |
30+f1+f2 |
2060+30f1+70f2 |
Now,  and
and ![]()
![]()
from (i)
![]()
using (i) and (ii)

Solution 9

Measures of Central Tendency (Mean, Median, Quartiles and Mode) Exercise Ex. 24(C)
Solution 2
Arranging the given data in descending order:
8, 7, 6, 5, 4, 3, 3, 1, 0
The middle term is 4 which is the 5th term.
Median = 4
Solution 3
Arranging the given data in descending order:
28.5, 28, 27.5, 25.5, 24, 24, 22, 21, 21, 20.5
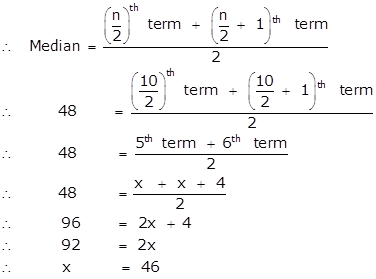
The middle terms are 24 and 24, 5th and 6th terms
![]()
Solution 4
Arranging in ascending order:
22, 24, 25, 26, 26, 27, 27, 28, 28, 29, 21, 32, 32, 33, 35, 35, 36, 36, 37
(i) Middle term is 10th term i.e. 29
Median = 29
(ii) Lower quartile =

(iii) Upper quartile =

(iv) Interquartile range = q3 - q1 =35 - 26 = 9
Solution 5
|
Weight (kg) x |
no. of boys f |
cumulative frequency |
|
37 |
10 |
10 |
|
38 |
14 |
24 |
|
39 |
18 |
42 |
|
40 |
12 |
54 |
|
41 |
6 |
60 |
Number of terms = 60
(i) median = the mean of the 30th and the 31st terms

(ii) lower quartile (Q1) = ![]()
(iii) upper quartile (Q3) = ![]()
(iv) Interquartile range = Q3 - Q1 = 40 - 38 = 2
Solution 6
|
Marks (less than) |
Cumulative frequency |
|
10 |
5 |
|
20 |
24 |
|
30 |
37 |
|
40 |
40 |
|
50 |
42 |
|
60 |
48 |
|
70 |
70 |
|
80 |
77 |
|
90 |
79 |
|
100 |
80 |
Number of terms = 80
\Median = 40th term.
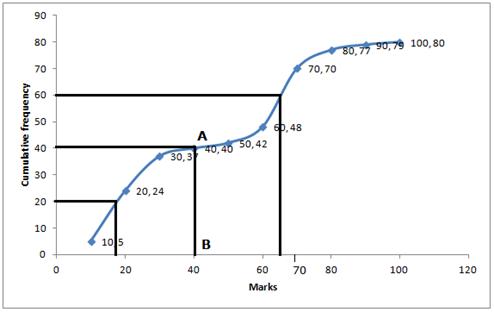
(i) Median = Through 40th term mark draw a line parallel to the x-axis which meets the curve at A. From A, draw a perpendicular to x-axis which meets it at B.
Value of B is the median = 40
(ii) Lower quartile (Q1) = 20th term = 18
(iii) Upper Quartile (Q3) = 60th term = 66
Solution 7
|
Height (in cm) |
No. of pupils |
Cumulative Frequency |
|
121 - 130 |
12 |
12 |
|
131 - 140 |
16 |
28 |
|
141 - 150 |
30 |
58 |
|
151 - 160 |
20 |
78 |
|
161 - 170 |
14 |
92 |
|
171 - 180 |
8 |
100 |
Number of terms = 100

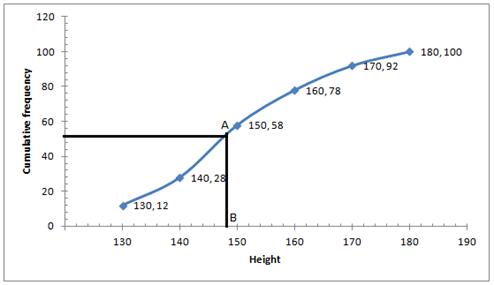
Through 50th term mark draw a line parallel to the x-axis which meets the curve at A. From A, draw a perpendicular to x-axis which meets it at B.
Value of B is the median = 148
 Median height = 148cm
Solution 8
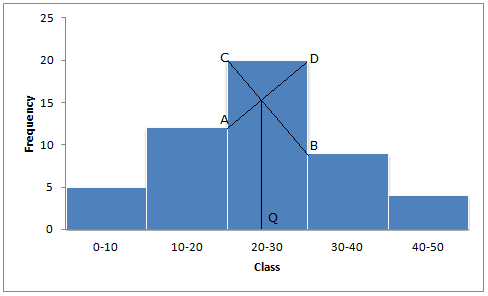
Mode is in 20-30, because in this class there are 20 frequencies.
Solution 9
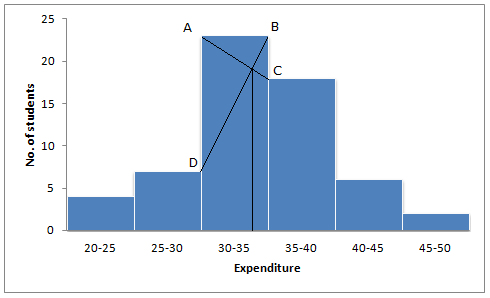
Mode is in 30-35 because it has the maximum frequency.
Solution 10
Arranging the given data in ascending order:
7, 10, 12, 12, 14, 15, 16, 16, 16, 17, 19
(i) Mode = 16 as it occurs maximum number of times.
(ii) ![]()
(iii)Total marks = 7+10+12+12+14+15+16+16+16+17+19 =
154
(iv) ![]()
Solution 11
|
Score x |
No. of shots f |
fx |
|
0 |
0 |
0 |
|
1 |
3 |
3 |
|
2 |
6 |
12 |
|
3 |
4 |
12 |
|
4 |
7 |
28 |
|
5 |
5 |
25 |
|
Total |
25 |
80 |
(i) Modal score = 4 as it has maximum frequency 7.
(ii) 
(iii) Total score = 80
(iv) ![]()
Measures of Central Tendency (Mean, Median, Quartiles and Mode) Exercise TEST YOURSELF
Solution 2
Mean of 1, 7, 5, 3, 4 and 4 = ![]()
 m=4
m=4
Now, mean of 3, 2, 4, 2, 3, 3 and p = m-1 = 4-1 = 3
Therefore, 17+p = 3 x n …. Where n = 7
17+p = 21
p = 4
Arranging in ascending order:
2, 2, 3, 3, 3, 3, 4, 4
Mean = 4th term = 3
Therefore, q = 3
Solution 3
|
Date |
Number |
C.f. |
|
1 |
5 |
5 |
|
2 |
12 |
17 |
|
3 |
20 |
37 |
|
4 |
27 |
64 |
|
5 |
46 |
110 |
|
6 |
30 |
140 |
|
7 |
31 |
171 |
|
8 |
18 |
189 |
|
9 |
11 |
200 |
|
10 |
5 |
205 |
|
11 |
0 |
205 |
|
12 |
1 |
206 |
(i) Mode = 5th July as it has maximum frequencies.
(ii) Total number of terms = 206
Upper quartile = 
Lower quartile = ![]()
Solution 4
|
Marks |
No. of students |
c.f. |
|
0-10 |
5 |
5 |
|
10-20 |
9 |
14 |
|
20-30 |
16 |
30 |
|
30-40 |
22 |
52 |
|
40-50 |
26 |
78 |
|
50-60 |
18 |
96 |
|
60-70 |
11 |
107 |
|
70-80 |
6 |
113 |
|
80-90 |
4 |
117 |
|
90-100 |
3 |
120 |
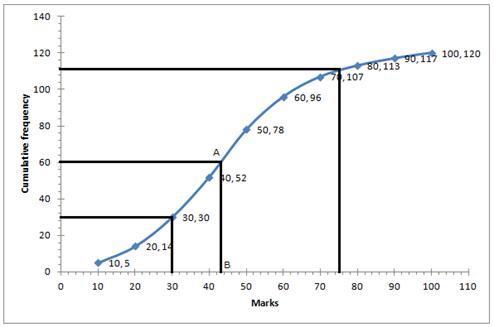
(i) ![]()
Through mark 60.5, draw a parallel line to x-axis which meets the curve at A, From A draw a perpendicular to x-axis meeting it at B.
The value of point B is the median = 43
(ii) Number of students who obtained up to 75% marks in the test = 110
Number of students who obtained more than 75% marks in the test = 120 - 110 = 10
(iii) Number of students who obtained less than 40% marks in the test = 52 (from the graph; x=40, y=52)
(iv) Lower quartile = Q1 = ![]()
Solution 5
|
Weight |
Frequency |
C. f. |
|
40-45 |
5 |
5 |
|
45-50 |
17 |
22 |
|
50-55 |
22 |
44 |
|
55-60 |
45 |
89 |
|
60-65 |
51 |
140 |
|
65-70 |
31 |
171 |
|
70-75 |
20 |
191 |
|
75-80 |
9 |
200 |
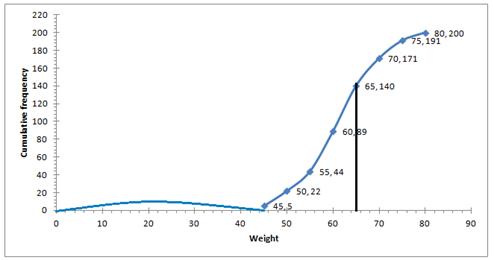
(i) Number of students weighing more than 55 kg = 200-44 = 156
Therefore, percentage of students weighing 55 kg or more
![]()
(ii) 30% of students = ![]()
Heaviest 60students in weight = 9 + 21 + 30 = 60
weight = 65 kg ( from table)
(iii) (a) underweight students when 55.70 kg is standard = 46 (approx) from graph
(b) overweight students when 55.70 kg is standard = 200- 55.70 = 154 (approx) from graph
Solution 6
|
Marks obtained(x) |
No. of students (f) |
c.f. |
fx |
|
5 |
3 |
3 |
15 |
|
6 |
9 |
12 |
54 |
|
7 |
6 |
18 |
42 |
|
8 |
4 |
22 |
32 |
|
9 |
2 |
24 |
18 |
|
10 |
1 |
25 |
10 |
|
Total |
25 |
171 |
Number of terms = 25
(i) Mean = 
(ii) ![]()
(iii) Mode = 6 as it has maximum frequencies i.e. 6
Solution 7
|
Monthly Income (thousands) |
No. of employees (f) |
Cumulative frequency |
|
6-7 |
20 |
20 |
|
7-8 |
45 |
65 |
|
8-9 |
65 |
130 |
|
9-10 |
95 |
225 |
|
10-11 |
60 |
285 |
|
11-12 |
30 |
315 |
|
12-13 |
5 |
320 |
|
Total |
320 |
Number of employees = 320
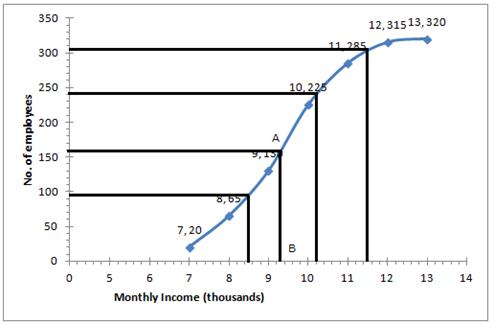
(i) ![]()
Through mark 160, draw a parallel line to x-axis which meets the curve at A, From A draw a perpendicular to x-axis meeting it at B.
The value of point B is the median = Rs 9.3 thousands
(ii) The number of employees with income below Rs 8500 = 95 (approx from the graph)
(iii) Number of employees with income below Rs 11500 = 305 (approx from the graph)
Therefore number of employees (senior employees) = 320-305 =15
(iv) Upper quartile = ![]()
Solution 8

Solution 9

Solution 10
![]()

Solution 11
Here the number of observations i. e is 10, which is even.'
So, the given data is 13, 35, 43, 46, 46, 50, 55, 61, 71, 80.
In the given data, 46 occurs most frequently.
∴ Mode = 46
Solution 12
i. The frequency distribution table is as follows:
|
Class interval |
Frequency |
|
0-10 |
2 |
|
10- 20 |
5 |
|
20-30 |
8 |
|
30-40 |
4 |
|
40-50 |
6 |
ii.
|
Class interval |
Frequency (f) |
Mean value (x) |
fx |
|
0-10 |
2 |
5 |
10 |
|
10- 20 |
5 |
15 |
75 |
|
20-30 |
8 |
25 |
200 |
|
30-40 |
4 |
35 |
140 |
|
40-50 |
6 |
45 |
270 |
|
|
Sf = 25 |
|
Sf = 695 |
![]()
iii. Here the maximum frequency is 8 which is corresponding to class 20 - 30.
Hence, the modal class is 20 - 30.
