
Class 9 RD SHARMA Solutions Maths Chapter 22 - Tabular Representation of Statistical Data
Tabular Representation of Statistical Data Exercise Ex. 22.1
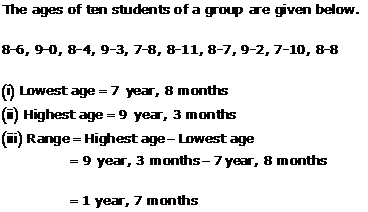
Solution 1
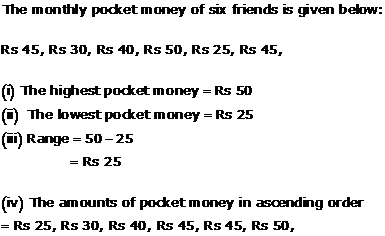
Solution 2
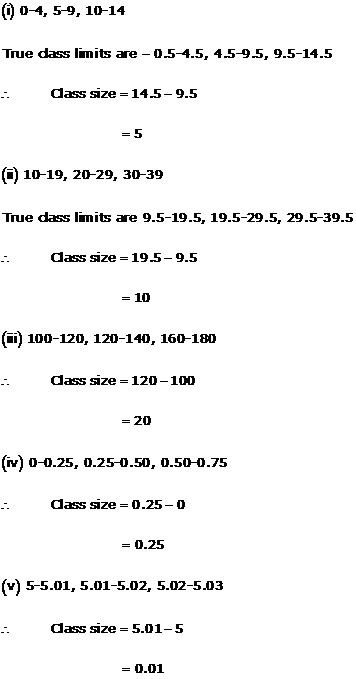
Solution 3
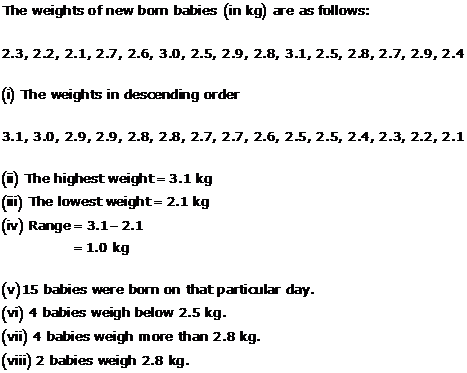
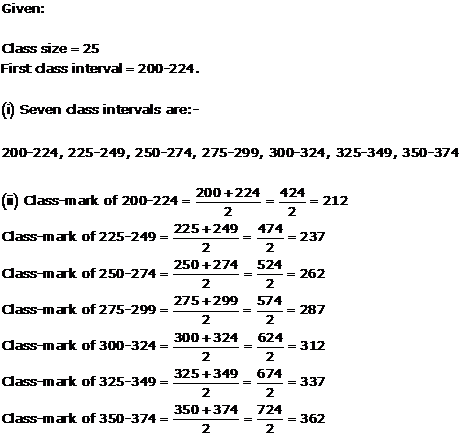
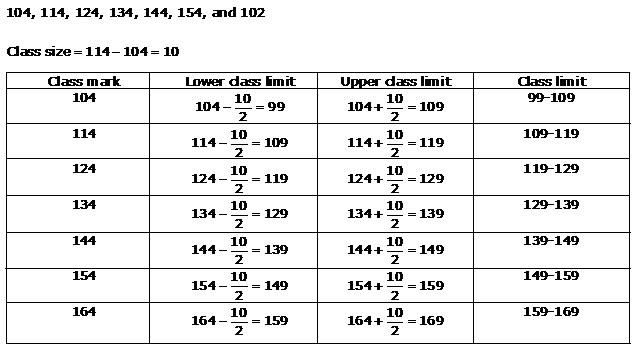
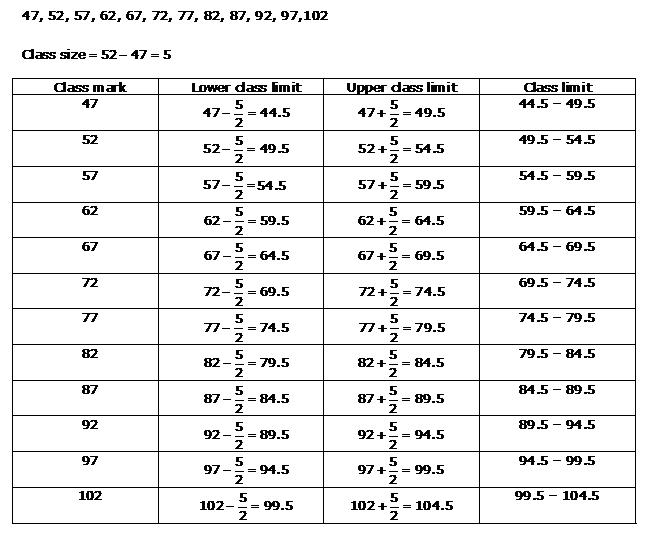
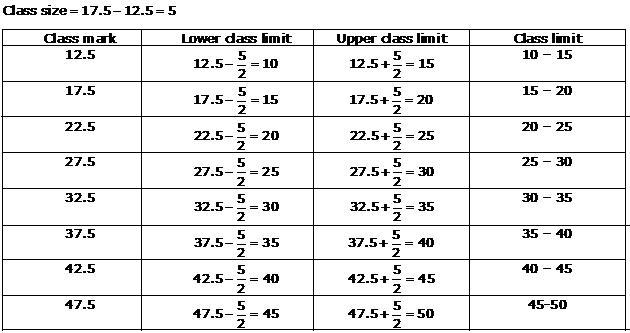
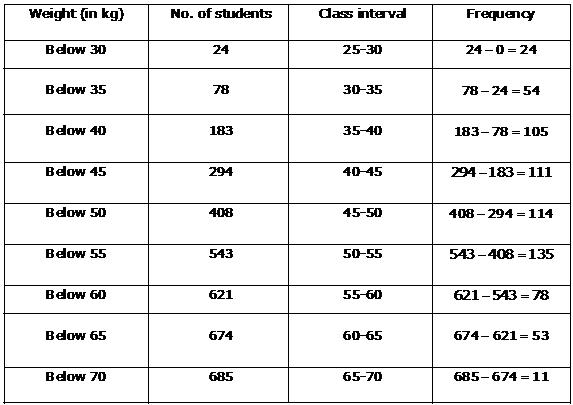
Solution 4
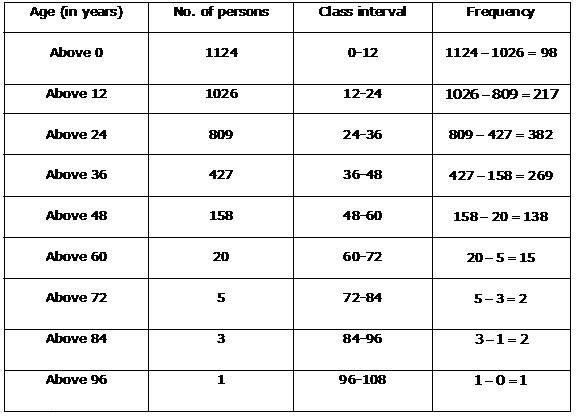
Solution 5
Solution 6
Solution 7
Solution 8
Solution 9
53,61,48,60,78,68,55,100,67,90,75,88,77,37,84,58,60,48,62,56,44,58,52,64,98,59,70,39,50,60
(i)
| Group | I(30-39) | II(40-49) | III(50-59) | IV(60-69) | V(70-79) | VI(80-89) | VII(90-99) | VIII(100-109) |
| Observations | 37, 39 | 44, 48, 48 | 50, 52, 53, 55, 56, 58, 58, 59 | 60, 60, 60, 61, 62, 64, 67, 68 | 70, 75, 77, 78 | 84, 88 | 90, 98 | 100 |
(ii) Highest score = 100
(iii) Lowest score = 37
(iv) Range = 100 - 37 = 63
(v) If 40 is the pass mark, 2 students have failed.
(vi) 8 students have scored 75 or more.
(vii) Observations 51, 54, 57 between 50 and 60 have not actually appeared.
(viii) 5 students have scored less than 50.
Solution 10
Solution 11
26, 35, 94, 48, 82, 105, 53, 0, 39, 42, 71, 0, 64, 15, 34, 67, 0, 42, 124, 84, 54, 48, 139, 64, 47.
(i) Runs in ascending order:- 0,0,0,15,26,34,35,39,42,42,47,48,48,53,54,64,64,67,71,82,84,94,105,124,139
(ii) The highest score = 139
(iii) The player did not score any run 3 times.
(iv) He scored 3 centuries.
(v) He scored more than 50 runs 12 times.
Solution 12
Solution 13
(ii)
(iii)
Solution 14
| Number of children | Tally marks | Number of families |
| 0 |  |
5 |
| 1 | ll |
7 |
| 2 | |
12 |
| 3 | |
5 |
| 4 | l |
6 |
| 5 | lll | 3 |
| 6 | lll | 3 |
Solution 15
| Marks | Tally marks | Frequency |
| 20 - 30 | l | 1 |
| 30 - 40 | lll | 3 |
| 40 - 50 |  |
5 |
| 50 - 60 | lll |
8 |
| 60 - 70 | lll |
8 |
| 70 - 80 | llll |
9 |
| 80 - 90 | llll | 4 |
| 90 - 100 | ll | 2 |
| Total = 40 |
Solution 16
| Heights (in cm) |
Tally marks | Frequency |
| 145 - 149 | llll | 4 |
| 150 - 154 |  llll llll |
9 |
| 155 - 159 | |
12 |
| 160 - 164 | |
5 |
| Total = 30 |
Solution 17
| Height (in cm) | Tally marks | Frequency |
| 800 - 810 | lll | 3 |
| 810 - 820 | ll | 2 |
| 820 - 830 | l | 1 |
| 830 - 840 |  lll lll |
8 |
| 840 - 850 | |
5 |
| 850 - 860 | l | 1 |
| 860 - 870 | lll | 3 |
| 870 - 880 | l | 1 |
| 880 - 890 | l | 1 |
| 890 - 900 | |
5 |
| Total = 30 |
Solution 18
| Maximum temperature (in degree Celsius) | Tally marks | Frequency |
| 20.0 - 21.0 |  l l |
6 |
| 21.0 - 22.0 | |
5 |
| 22.0 - 23.0 | llll |
9 |
| 23.0 - 24.0 | |
5 |
| 24.0 - 25.0 | lll | 3 |
| 25.0 - 26.0 | ll | 2 |
| Total = 30 |
Solution 19
| Monthly wages (in rupees) | Tally marks | Frequency |
| 210 - 230 | llll | 4 |
| 230 - 250 | llll | 4 |
| 250 - 270 |  |
5 |
| 270 - 290 | lll | 3 |
| 290 - 310 | ll |
7 |
| 310 - 330 | |
5 |
| Total = 28 |
Solution 20
So, the table representing the data is as follows:
|
Blood group |
Number of students |
|
A |
9 |
|
B |
6 |
|
AB |
3 |
|
O |
12 |
|
Total |
30 |
As 12 students have the blood group O and 3 have their blood group as AB. Clearly, the most common blood group among these students is O and the rarest blood group among these students is AB.
Solution 21
|
Number of heads |
Number of times (frequency) |
|
0 |
6 |
|
1 |
10 |
|
2 |
9 |
|
3 |
5 |
|
Total |
30 |
Solution 22
The grouped frequency distribution table is as follows:
|
Hours |
Number of children |
|
0 - 5 |
10 |
|
5 - 10 |
13 |
|
10 - 15 |
5 |
|
15 - 20 |
2 |
|
Total |
30 |
(ii) The number of children, who watched TV for 15 or more hours a week
is 2 (i.e. number of children in class interval 15 - 20).
Solution 23
Since first class interval is -19.9 to -15
Frequency distribution with lower limit included and upper limit excluded is:
| Temperature | Tally marks | Frequency |
| -19.9 to -15 | ll | 2 |
| -15 to -10.1 |  ll ll |
7 |
| -10.1 to -5.2 | |
5 |
| -5.2 to -0.3 | llll | 4 |
| -0.3 to 4.6 | |
17 |
| Total | 35 |
Tabular Representation of Statistical Data Exercise Ex. 22.2
Solution 1

Solution 2
Solution 3
Solution 4
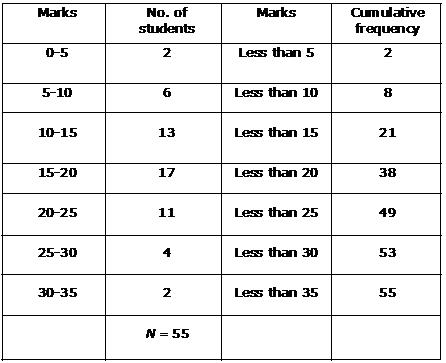
| Age (in years): | No. of patients | Age (in years) | Cumulative frequency |
| 10 - 20 | 90 | Less than 20 | 90 |
| 20 - 30 | 50 | Less than 30 | 140 |
| 30 - 40 | 60 | Less than 40 | 200 |
| 40 - 50 | 80 | Less than 50 | 280 |
| 50 - 60 | 50 | Less than 60 | 330 |
| 60 - 70 | 30 | Less than 70 | 360 |
| N = 360 |
Solution 5
Solution 6
Solution 7
Solution 8
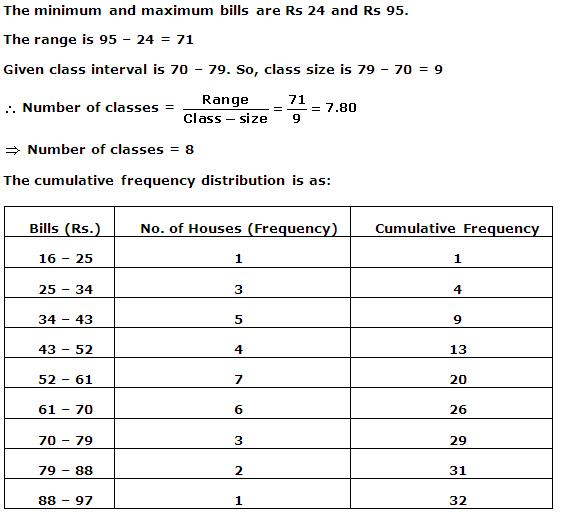
| Consumption (in kW) | No. of Factories | Class interval | Frequency |
| Below 240 | 1 | 0 - 240 | 1 |
| Below 270 | 4 | 240 - 270 | 4 - 1 = 3 |
| Below 300 | 8 | 270 - 300 | 8 - 4 = 4 |
| Below 330 | 24 | 300 - 330 | 24 - 8 = 16 |
| Below 360 | 33 | 330 - 360 | 33 - 24 = 9 |
| Below 390 | 38 | 360 - 390 | 38 - 33 = 5 |
| Below 420 | 40 | 390 - 420 | 40 - 38 = 2 |
(ii)
| Class interval | Frequency | Consumption (in kW) | No. of factories |
| 0 - 240 | 1 | More than 0 | 40 |
| 240 - 270 | 3 | More than 270 | 40 - 1 = 39 |
| 270 - 300 | 4 | More than 270 | 39 - 3 = 36 |
| 300 - 330 | 16 | More than 300 | 36 - 4 = 32 |
| 330 - 360 | 9 | More than 330 | 32 - 16 = 16 |
| 360 - 390 | 5 | More than 360 | 16 - 9 = 7 |
| 390 - 420 | 2 | More than 390 | 7 - 5 = 2 |
| More than 420 |
2 - 2 = 0 |
||
| N = 40 | |
Solution 9
Tabular Representation of Statistical Data Exercise 22.26
Solution 1
When observations are large, it may not be easy to find the frequencies by simple counting.
So, we make use of tally marks.
Thus, Tally marks are used to find frequency.
Hence, correct option is (c).
Solution 2
The difference between the highest and lowest value of observations is called 'Range' of observations.
Hence, correct option is (c).
Solution 3
The difference between the upper class limit and the lower class limit is called class size.
Hence, correct option is (b).
Solution 4
Since, 10 - 20, 20 - 30 are Exclusive Class Intervals, the upper limit of a class is not included in the class.
Thus, 20, will be taken in the class 20 - 30.
Hence, correct option is (b).
Solution 5

Solution 6

Tabular Representation of Statistical Data Exercise 22.27
Solution 7
The number of times a particular item occurs in a given data is called its Frequency.
Hence, correct option is (b).
Solution 8
Number of classes = 9
Lower limit of the lowest class = 10.6
Width of each class = 2.5
So, Upper limit of the lowest class = 10.6 + 2.5 = 13.1
Now, Upper limit of the lowest class + Width of each class = Upper limit of the next class
Thus, we have
Upper limit of the lowest class + 8 × width of each class = Upper limit of the highest (9th) class
Upper limit of the highest (9th) class = 13.1 + 8 × 2.5 = 33.1
Hence, correct option is (b).
Solution 9
Range of observations = Highest observation - Lowest observation
= 95 - 62
= 33
Hence, correct option is (d).
Solution 10
Tally are usually marked in a bunch of 5: 4 in a vertical line and one is placed diagonally.
Hence, correct option is (c).
Solution 11

