
Class 10 R S AGGARWAL AND V AGGARWAL Solutions Maths Chapter 18 - Mean, Median, Mode of Grouped Data, Cumulative Frequency Graph and Ogive
Mean, Median, Mode of Grouped Data, Cumulative Frequency Graph and Ogive Exercise Ex. 18A
Solution 1

Solution 2

Solution 3
We form the table as below:
|
Class |
Frequency fi |
Class mark xi |
(fi × xi) |
|
10-30 |
15 |
20 |
300 |
|
30-50 |
18 |
40 |
720 |
|
50-70 |
25 |
60 |
1500 |
|
70-90 |
10 |
80 |
800 |
|
90-110 |
2 |
100 |
200 |
|
|
𝛴fi = 70 |
|
𝛴(fi × xi) = 3520 |
Therefore, mean 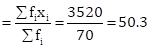
Solution 4
We form the table as below:
|
Class |
Frequency fi |
Class mark xi |
(fi × xi) |
|
0-20 |
6 |
10 |
60 |
|
20-40 |
8 |
30 |
240 |
|
40-60 |
10 |
50 |
500 |
|
60-80 |
12 |
70 |
840 |
|
80-100 |
6 |
90 |
540 |
|
100-120 |
5 |
110 |
550 |
|
120-140 |
3 |
130 |
390 |
|
|
𝛴fi = 50 |
|
𝛴(fi × xi) = 3120 |
Therefore, mean 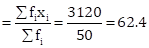
Solution 5
We form the table as below:
|
Class |
Frequency fi |
Class mark xi |
(fi × xi) |
|
0-6 |
10 |
3 |
30 |
|
6-12 |
11 |
9 |
99 |
|
12-18 |
7 |
15 |
105 |
|
18-24 |
4 |
21 |
84 |
|
24-30 |
4 |
27 |
108 |
|
30-36 |
3 |
33 |
99 |
|
36-42 |
1 |
39 |
39 |
|
|
𝛴fi = 40 |
|
𝛴(fi × xi) = 564 |
Therefore, mean
number of days ![]()
Solution 6
We form the table as below:
|
Class |
Frequency fi |
Class mark xi |
(fi × xi) |
|
500-700 |
6 |
600 |
3600 |
|
700-900 |
8 |
800 |
6400 |
|
900-1100 |
10 |
1000 |
10000 |
|
1100-1300 |
9 |
1200 |
10800 |
|
1300-1500 |
7 |
1400 |
9800 |
|
|
𝛴fi = 40 |
|
𝛴(fi × xi) = 40600 |
Therefore, mean daily
expenses 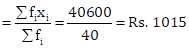
Solution 7
We form the table as below:
|
Class |
Frequency fi |
Class mark xi |
(fi × xi) |
|
64-68 |
6 |
66 |
396 |
|
68-72 |
8 |
70 |
560 |
|
72-76 |
10 |
74 |
740 |
|
76-80 |
12 |
78 |
936 |
|
80-84 |
3 |
82 |
246 |
|
84-88 |
1 |
86 |
86 |
|
|
𝛴fi = 40 |
|
𝛴(fi × xi) = 2964 |
Therefore, mean
heartbeats per minute 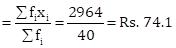
Solution 8
Here, class size, h = 10.
Let the assumed mean be A = 35.
For calculating the mean age, we prepare the following table:
|
Class |
Frequency fi |
Class mark xi |
|
(fi × ui) |
|
0-10 |
105 |
5 |
-3 |
-315 |
|
10-20 |
222 |
15 |
-2 |
-444 |
|
20-30 |
220 |
25 |
-1 |
-220 |
|
30-40 |
138 |
35 |
0 |
0 |
|
40-50 |
102 |
45 |
1 |
102 |
|
50-60 |
113 |
55 |
2 |
226 |
|
60-70 |
100 |
65 |
3 |
300 |
|
|
𝛴fi = 1000 |
|
|
𝛴(fi × ui) = -351 |

Therefore,
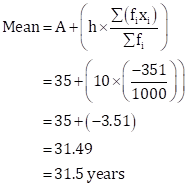
Thus, the mean age of persons visiting the marketing centre on that day is 31.5 years.
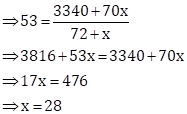
Solution 9
|
Class |
Frequency fi |
Class mark xi |
(fi × xi) |
|
0-20 |
12 |
10 |
120 |
|
20-40 |
15 |
30 |
450 |
|
40-60 |
32 |
50 |
1600 |
|
60-80 |
x |
70 |
70x |
|
80-100 |
13 |
90 |
1170 |
|
|
𝛴fi = 72 + x |
|
𝛴(fi × xi) = 3340 + 70x |
Arithmetic mean 
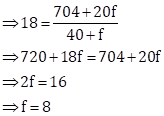
Solution 10
|
Class |
Frequency fi |
Class mark xi |
(fi × xi) |
|
11-13 |
3 |
12 |
36 |
|
13-15 |
6 |
14 |
84 |
|
15-17 |
9 |
16 |
144 |
|
17-19 |
13 |
18 |
234 |
|
19-21 |
f |
20 |
20f |
|
21-23 |
5 |
22 |
110 |
|
23-25 |
4 |
24 |
96 |
|
|
𝛴fi = 40 + f |
|
𝛴(fi × xi) = 704 + 20f |
Arithmetic mean
Solution 11

Solution 12

Solution 13

Solution 14
We have
![]()
|
Class |
Frequency
|
Mid Value
|
|
|
0 - 20 |
7 |
10 |
70 |
|
20 - 40 |
|
30 |
30 |
|
40 - 60 |
12 |
50 |
600 |
|
60 - 80 |
|
70 |
1260 - 70 |
|
80 - 100 |
8 |
90 |
720 |
|
100 - 120 |
5 |
110 |
550 |
|
|
|


Solution 15
|
Class |
Frequency fi |
Class mark xi |
(fi × xi) |
|
0-80 |
20 |
40 |
800 |
|
80-160 |
25 |
120 |
3000 |
|
160-240 |
x |
200 |
200x |
|
240-320 |
y |
280 |
280y |
|
320-400 |
10 |
360 |
3600 |
|
|
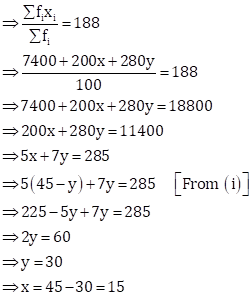
𝛴fi = 55 + x + y |
|
𝛴(fi × xi) = 7400 + 200x + 280y |
Now,
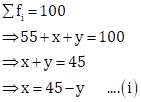
Also, arithmetic mean = 188
Solution 16

Solution 17
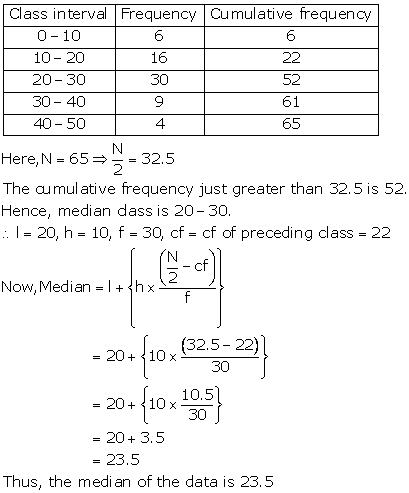
We have, Let A = 25 be the assumed mean.
|
Marks |
Frequency
|
Mid value
|
Deviation
|
|
|
0 - 10 10 - 20 20 - 30 30 - 40 40 - 50 50 - 60 |
12 18 27 20 17 6 |
5 15 25 = A 35 45 55 |
-20 -10 0 10 20 30 |
-240 -180 0 200 340 180 |
|
|
|


![]()
Hence, mean marks per student = 28
Solution 18
Let the assumed mean be 150, h = 20
|
Marks |
Frequency
|
Mid value
|
Deviation di = |
|
|
100 - 120 120 - 140 140 - 160 160 - 180 180 - 200 |
10 20 30 15 5 |
110 130 150=A 170 190 |
-40 -20 0 20 40 |
-400 -400 0 300 200 |
|
|
|
![]()
Hence, Mean = 146.25
Solution 19
Let A = 50 be the assumed mean, we have
|
Marks |
Frequency
|
Mid value
|
Deviation
|
|
|
0 - 20 20 - 40 40 - 60 60 - 80 80 - 100 100 - 120 |
20 35 52 44 38 31 |
10 30 50 = A 70 90 110 |
-40 -20 0 20 40 60 |
-800 -700 0 880 1520 1860 |
|
|
|


Solution 20

Solution 21

Solution 22

Solution 23

Solution 24

Solution 25
Let h = 20 and assume mean = 550, we prepare the table given below:
|
Age |
Frequency
|
Mid value
|
|
|
|
500 - 520 520 - 540 540 - 560 560 - 580 580 - 600 600 - 620 |
14 9 5 4 3 5 |
510 530 550 = A 570 590 610 |
-2 -1 0 1 2 3 |
-27 -9 0 4 6 15 |
|
|
|


Thus, A = 550, h = 20, and ![]()
![]() = 40,
= 40, ![]()
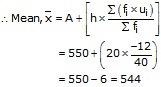
Hence, the mean of the frequency distribution is 544.
Solution 26
The given series is an inclusive series, making it an exclusive series, we have
|
Class |
Frequency
|
Mid value
|
|
|
|
24.5 - 29.5 29.5 - 34.5 34.5 - 39.5 39.5 - 44.5 44.5 - 49.5 49.5 - 54.5 54.5 - 59.5 |
4 14 22 16 6 5 3 |
27 32 37 42 = A 47 52 57 |
-3 -2 -1 0 1 2 3 |
-12 -28 -22 0 6 10 9 |
|
|
|


Thus, A = 42, h = 5, ![]()
![]() = 70 and
= 70 and ![]()

Hence, Mean = 39.36 years
Solution 27
The given series is an inclusive series making it an exclusive series,we get
|
class |
Frequency
|
Mid value
|
|
|
|
4.5 - 14.5 14.5 - 24.5 24.5 - 34.5 34.5 - 44.5 44.5 - 54.5 54.5 - 64.5 |
6 11 21 23 14 5 |
9.5 19.5 29.5=A 39.5 49.5 59.5 |
-2 -1 0 1 2 3 |
-12 -11 0 23 28 15 |
|
|
|


Thus, A = 29.5, h = 10, ![]()
![]() = 80 and
= 80 and ![]()
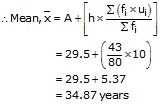
Hence, Mean = 34.87 years
Solution 28

Solution 29

Mean, Median, Mode of Grouped Data, Cumulative Frequency Graph and Ogive Exercise Ex. 18B
Solution 1

Solution 2
We prepare the frequency table, given below
|
Marks |
No. of students |
C.F. |
|
0 - 7 7 - 14 14 - 21 21 - 28 28 - 35 35 - 42 42 - 49 |
3 4 7 11 0 16 9 |
3 7 14 25 25 41 50 |
|
N = |
Now, 
The cumulative frequency is 25 and corresponding class is 21 - 28.
Thus, the median class is 21 - 28
l = 21, h = 7, f = 11, c = C.F. preceding class 21 - 28 is 14 and ![]() = 25
= 25

Hence the median is 28.
Solution 3
We prepare the frequency table given below:
|
Daily wages |
Frequency |
C.F. |
|
0 - 100 100 - 200 200 - 300 300 - 400 400 - 500 |
40 32 48 22 8 |
40 72 120 142 150 |
|
N = |
Now, N = 150, therefore 
The cumulative frequency just greater than 75 is 120 and corresponding class is 200 - 300.
Thus, the median class is 200 - 300
l = 200, h = 100, f = 48
c = C.F. preceding median class = 72 and ![]()

Hence the median of daily wages is Rs. 206.25.
Solution 4
We prepare the frequency table, given below:
|
Class |
Frequency
|
C.F |
|
5 - 10 10 - 15 15 - 20 20 - 25 25 - 30 30 - 35 35-40 40 - 45 |
5 6 15 10 5 4 2 2 |
5 11 26 36 41 45 47 49 |
|
|
Now, N = 49 
The cumulative frequency just greater than 24.5 is 26 and corresponding class is 15 - 20.
Thus, the median class is 15 - 20
![]() l = 15, h = 5, f = 15
l = 15, h = 5, f = 15
c = CF preceding median class = 11 and![]()

Median of frequency distribution is 19.5
Solution 5
We prepare the cumulative frequency table as given below:
|
Consumption |
Frequency
|
C.F |
|
65 - 85 85 - 105 105 - 125 125 - 145 145 - 165 165 - 185 185 - 205 |
4 5 13 20 14 7 4 |
4 9 22 42 56 63 67 |
|
N = |
Now, N = 67
The cumulative frequency just greater than 33.5 is 42 and the corresponding class 125 - 145.
Thus, the median class is 125 - 145
![]() l = 125, h = 20,
l = 125, h = 20, ![]() and c = CF preceding the median class = 22,
and c = CF preceding the median class = 22, ![]() = 33.5
= 33.5

Hence median of electricity consumed is 136.5
Solution 6
Frequency table is given below:
|
Height |
Frequency
|
C.F |
|
135 - 140 140 - 145 145 - 150 150 - 155 155 - 160 160 - 165 165 - 170 170 - 175 |
6 10 18 22 20 15 6 3 |
6 16 34 56 76 91 97 100 |
|
N = |
N = 100, 
The cumulative frequency just greater than 50 is 56 and the corresponding class is 150 - 155
Thus, the median class is 150 - 155
l = 150, h = 5, f = 22, c = C.F.preceding median class = 34

Hence, Median = 153.64
Solution 7
The frequency table is given below. Let the missing frequency be x.
|
Class |
Frequency
|
C.F |
|
0 - 10 10 - 20 20 - 30 30 - 40 40 - 50 |
5 25 x 18 7 |
5 30 30 + x 48 + x 55 + x |
Median = 24 ![]() Median class is 20 - 30
Median class is 20 - 30
![]()
l = 20, h = 10, f = x, c = C.F. preceding median class = 30
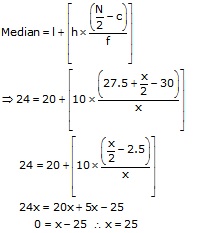
Hence, the missing frequency is 25.
Solution 8

Solution 9

Solution 10
Let ![]() be the frequencies of class intervals 0 - 10 and 40 - 50
be the frequencies of class intervals 0 - 10 and 40 - 50
![]()
Median is 32.5 which lies in 30 - 40, so the median class is 30 - 40
l = 30, h = 10, f = 12, N = 40 and ![]()

Solution 11
The given series is of inclusive form. Converting it into exclusive form and preparing the cumulative frequency table, we get
|
Class |
Frequency
|
C.F |
|
18.5 - 25.5 25.5 - 32.5 32.5 - 39.5 39.5 - 46.5 46.5 - 53.5 53.5 - 60.5 |
35 96 68 102 35 4 |
35 131 199 301 336 340 |
|
|

The cumulative frequency just greater than 170 is 199 and the corresponding class is 32.5 - 39.5.
![]() Median class is 32.5 - 39.5
Median class is 32.5 - 39.5
![]() l = 32.5, h = 7, f = 68, c = C.F. of preceding median class = 131
l = 32.5, h = 7, f = 68, c = C.F. of preceding median class = 131

Hence median is 36.5 years
Solution 12
Given series is in inclusive form converting it into exclusive form and preparing the cumulative frequency table, we get
|
Wages per day (in Rs) |
Frequency
|
C.F |
|
60.5 - 70.5 70.5 - 80.5 80.5 - 90.5 90.5 - 100.5 100.5 - 110.5 110.5 - 120.5 |
5 15 20 30 20 8 |
5 20 40 70 90 98 |
|
|

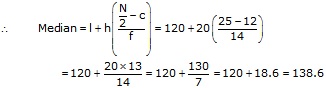
The cumulative frequency just greater than 49 is 70 and corresponding class is 90.5 - 100.5.
![]() median class is 90.5 - 100.5
median class is 90.5 - 100.5
![]() l = 90.5, h = 10, f = 30, c = CF preceding median class = 40
l = 90.5, h = 10, f = 30, c = CF preceding median class = 40

Hence, Median = Rs 93.50
Solution 13
The given series is converted from inclusive to exclusive form and preparing the cumulative frequency table, we get
|
Marks |
Frequency
|
C.F |
|
0.5 - 5.5 5.5 - 10.5 10.5 - 15.5 15.5 - 20.5 20.5 - 25.5 25.5 - 30.5 30.5 - 35.5 35.5 - 40.5 40.5 - 45.5 |
7 10 16 32 24 16 11 5 2 |
7 17 33 65 89 105 116 121 123 |
|
|

The cumulative frequency just greater than 61.5 is 65.
![]() The corresponding median class is 15.5 - 20.5.
The corresponding median class is 15.5 - 20.5.
Then the median class is 15.5 - 20.5
![]() l = 15.5, h = 5, f = 32, c = C.F. preceding median class = 33
l = 15.5, h = 5, f = 32, c = C.F. preceding median class = 33

Hence, Median = 19.95
Solution 14
|
Marks |
Frequency
|
C.F |
|
0 - 10 10 - 20 20 - 30 30 - 40 40 - 50 50 - 60 60 - 70 70 - 80 |
12 20 25 23 12 24 48 36 |
12 32 57 80 92 116 164 200 |
|
N = |

The cumulative frequency just greater than 100 is 116 and the corresponding class is 50 - 60.
Thus the median class is 50 - 60
![]() l = 50, h = 10, f = 24, c = C.F. preceding median class = 92,
l = 50, h = 10, f = 24, c = C.F. preceding median class = 92, ![]() = 100
= 100

Hence, Median = 53.33
Mean, Median, Mode of Grouped Data, Cumulative Frequency Graph and Ogive Exercise Ex. 18C
Solution 1

Solution 2

Solution 3

Solution 4
As the class 26 - 30 has maximum frequency so it is modal class

Hence, mode = 28.5
Solution 5
As the class 1500 - 2000 has maximum frequency, so it os modal class
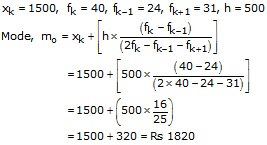
Hence the average expenditure done by maximum number of workers = Rs. 1820
Solution 6
As the class 5000 - 10000 has maximum frequency, so it is modal class

Hence, mode = Rs. 7727.27
Solution 7
As the class 15 - 20 has maximum frequency so it is modal class.
![]()

Hence mode = 17.3 years
Solution 8
As the class 85 - 95 has the maximum frequency it is modal class

Hence, mode = 85.71
Solution 9
The given series is converted from inclusive to exclusive form and on preparing the frequency table, we get
|
Class |
Frequency |
|
0.5 - 5.5 5.5- 10.5 10.5 - 15. 5 15.5 - 20.5 20.5 - 25. 5 25.5 - 30.5 30.5 - 35.5 35.5 - 40.5 40.5 - 45.5 45.5 - 50.5 |
3 8 13 18 28 20 13 8 6 3 |
As the class 20.5 - 25.5 has maximum frequency, so it is modal class


Hence, mode = 23.28
Solution 10

Mean, Median, Mode of Grouped Data, Cumulative Frequency Graph and Ogive Exercise Ex. 18D
Solution 1
Mean:
|
Class |
Frequency fi |
Cumulative frequency |
Class mark xi |
(fi × xi) |
|
0-10 |
4 |
4 |
5 |
20 |
|
10-20 |
4 |
8 |
15 |
60 |
|
20-30 |
7 |
15 |
25 |
175 |
|
30-40 |
10 |
25 |
35 |
350 |
|
40-50 |
12 |
37 |
45 |
540 |
|
50-60 |
8 |
45 |
55 |
440 |
|
60-70 |
5 |
50 |
65 |
325 |
|
|
𝛴fi = 50 |
|
|
𝛴(fi × xi) = 1910 |
Therefore, mean 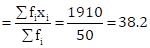
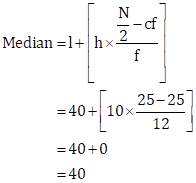
Median:
![]()
Cumulative frequency just greater than 25 is 37 and the corresponding class is 40-50.
Thus, the median class = 30-40
![]()
Mode:
Mode = 3(Median) - 2(Mean)
= 3(40) - 2(38.2)
= 120 - 76.4
= 43.6
Solution 2

Solution 3

Solution 4

Solution 5
Let the assumed mean A be 145.Class interval h = 10.
|
Class |
Frequency
|
Mid-Value
|
|
|
C.F. |
|
120-130 130-140 140-150 150-160 160-170 |
2 8 12 20 8 |
125 135 145=A 155 165 |
-2 -1 0 1 2 |
-4 -8 0 20 16 |
2 10 22 42 50 |
|
N = 50 |
|


(i)Mean 
![]()
(ii)N = 50, ![]()
Cumulative frequency just after 25 is 42
Corresponding median class is 150 - 160
Cumulative frequency before median class, c = 22
Median class frequency f = 20

(iii)Mode = 3 median - 2 mean
= 3 151.5 - 2 149.8 = 454.5 - 299.6
= 154.9
Thus, Mean = 149.8, Median = 151.5, Mode = 154.9
Solution 6
|
Class |
Frequency |
Mid-value
|
|
|
C.F. |
|
100-120 120-140 140-160 160-180 180-200 |
12 14 8 6 10 |
110 130 150= A 170 190 |
-2 -1 0 1 2 |
-24 -14 0 6 20 |
12 26 34 40 50 |
|
N = 50 |
|


Let assumed mean A = 150 and h = 20
(i)Mean 
![]()
(ii)![]()
Cumulative frequency just after 25 is 26
![]() Corresponding frequency median class is 120 - 140
Corresponding frequency median class is 120 - 140
So, l = 120, f = 14, ![]() h = 20, c = 12
h = 20, c = 12
(iii)Mode = 3Median - 2Mode
= 3(138.6) - 2(145.2)
= 415.8 - 190.4
= 125.4
Hence, Mean = 145.2, Median = 138.6 and Mode = 125.4
Solution 7
|
Class |
Frequency |
Mid-value
|
|
|
C.F. |
|
100-150 150-200 200-250 250-300 300-350 |
6 7 12 3 2 |
125 175 225 275 325 |
-2 -1 0 1 2 |
-12 -7 0 3 4 |
6 13 25 28 30 |
|
N = 30 |
|


Let assumed mean = 225 and h = 50
(i)Mean = 
(ii)![]()
Cumulative frequency just after 15 is 25
![]() corresponding class interval is 200 - 250
corresponding class interval is 200 - 250
![]() Median class is 200 - 250
Median class is 200 - 250
Cumulative frequency c just before this class = 13
![]()

Hence, Mean = 205 and Median = 208.33
Mean, Median, Mode of Grouped Data, Cumulative Frequency Graph and Ogive Exercise Ex. 18E
Solution 1

We plot the points (10, 5), (20, 8), (30, 12), (40, 15), (50, 18), (60, 22), (70, 29), (80, 38), (90, 45) and (100, 53) to get the 'less than type' ogive as follows:
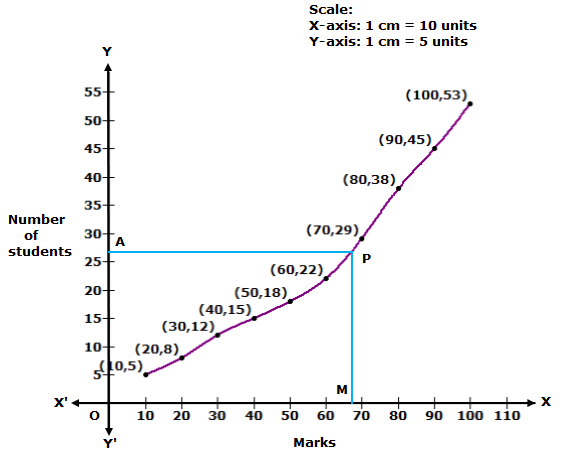
![]()
At y = 26.5, affix A.
Through A, draw a horizontal line meeting the curve at P.
Through P, a vertical line is drawn which meets OX at M.
OM = 68 units
Hence, median marks = 68
Solution 2
|
Number of wickets |
Less than 15 |
Less than 30 |
Less than 45 |
Less than 60 |
Less than 75 |
Less than 90 |
Less than 105 |
Less than 120 |
|
Number of bowlers |
2 |
5 |
9 |
17 |
39 |
54 |
70 |
80 |
We plot the points (15, 2), (30, 5), (45, 9), (60, 17), (75, 39), (90, 54), (105, 70) and (120, 80) to get the 'less than type' ogive as follows:
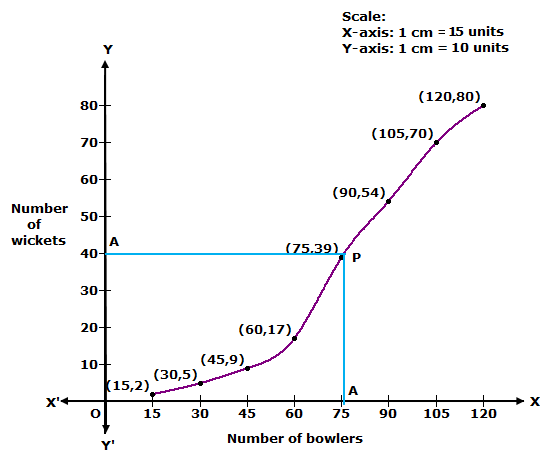
![]()
At y = 40, affix A.
Through A, draw a horizontal line meeting the curve at P.
Through P, a vertical line is drawn which meets OX at M.
OM = 78 units
Hence, median number of wickets = 78
Solution 3
'More than type' distribution is as follows:

We plot the points (0, 100), (10, 96), (20, 90), (30, 80), (40, 70), (50, 45), (60, 23) and (70, 5) to get the 'more than type' ogive as follows:

Solution 4
'More than type' distribution is as follows:

We plot the points (135, 50), (140, 45), (145, 37), (150, 28), (155, 16) and (160, 2) to get the 'more than type' ogive as follows:

Solution 5
'More than type' distribution is as follows:

We plot the points (140, 156), (160, 153), (180, 145), (200, 130), (220, 90), (240, 40) and (260, 10) to get the 'more than type' ogive as follows:

Solution 6

We plot the points (50, 100), (55, 98), (60, 90), (65, 78), (70, 54) and (75, 16) to get the 'more than type' ogive as follows:
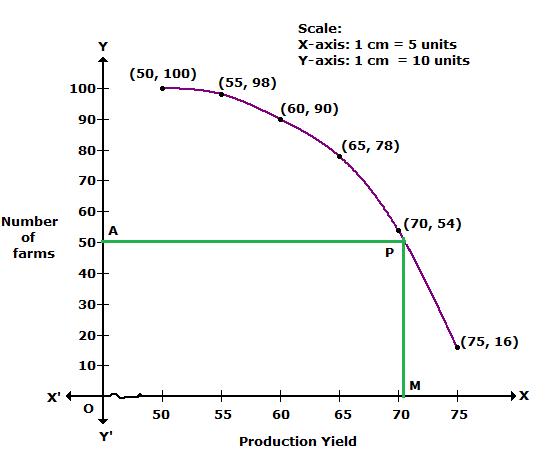
![]()
At y = 50, affix A.
Through A, draw a horizontal line meeting the curve at P.
Through P, a vertical line is drawn which meets OX at M.
OM = 70.5 units
Hence, median production yield = 70.5 kg/ha
Solution 7
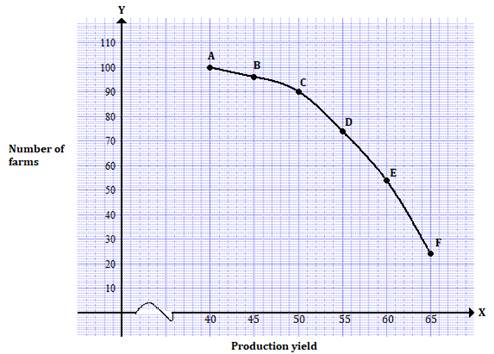
'More than type' distribution is as follows:
|
Production yield |
Number of farms |
|
More than 65 |
24 |
|
More than 60 |
54 |
|
More than 55 |
74 |
|
More than 50 |
90 |
|
More than 45 |
96 |
|
More than 40 |
100 |
On a graph paper, we plot the points A(40, 100), B(45, 96), C(50, 90), D(55, 74), E(60, 54) and F(65, 24).
Join these points to get a 'More than Ogive'.
Solution 8
More than series
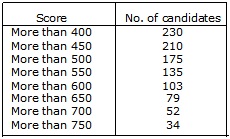
We plot the points (400, 230), (450, 210), (500, 175), (550, 135), (600, 103), (650, 79), (700, 52), (750, 34)
Hence,![]()
Take a point A(0, 115) on the y-axis and draw AP||x-axis meeting the curve at P, Draw PM ![]() x-axis intersecting x-axis at M
x-axis intersecting x-axis at M
Then,OM = 590
Hence median = 590
Solution 9
(i) Less than series:
|
Marks |
No. of students |
|
Less than 5 Less than 10 Less than 15 Less than 20 Less than 25 Less than 30 Less than 35 Less than 40 Less than 45 Less than 50 |
2 7 13 21 31 56 76 94 98 100 |
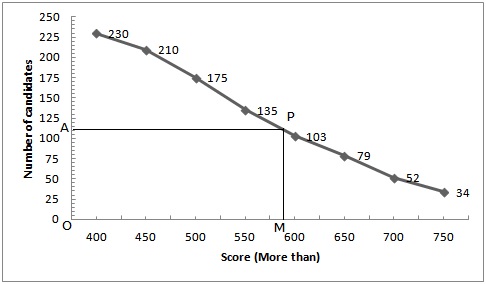
Plot the points (5, 2), (10, 7), (15, 13), (20, 21), (25, 31), (30, 56), (35, 76), (40, 94), (45, 98) and (50, 100)
Join these points free hand to get the curve representing "less than" cumulative curve.
(ii)From the given table we may prepare the 'more than' series as shown below
|
Marks |
No. of students |
|
More than 45 More than 40 More than 35 More than 30 More than 25 More than 20 More than 15 More than 10 More than 5 More than 0 |
2 6 24 44 69 79 87 93 98 100 |
Now, on the same graph paper as above, we plot the point (0, 100), (5, 98), (10, 93), (15, 87), (20, 79), (25, 69), (30, 44), (35, 24) and (40, 6) and (45, 2)
Join these points free hand to get the required curve.
Here ![]()
Two curves intersect at point P(28, 50)
Hence, the median = 28
Solution 10
We may prepare less than series and more than series
(i)Less than series
|
Height in (cm) |
Frequency |
|
Less than 140 Less than 144 Less than 148 Less than 152 Less than 156 Less than 160 Less than 164 Less than 168 Less than 172 Less than 176 Less than 180 |
0 3 12 36 67 109 173 248 330 416 450 |
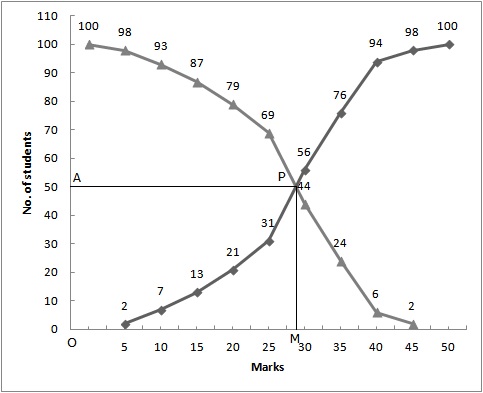
Now on graph paper plot the points (140, 0), (144, 3), (148, 12), (152, 36), (156, 67), (160, 109), (164, 173), (168, 248), (172, 330), (176, 416), (180, 450)
(ii)More than series
|
Height in cm |
C.F. |
|
More than 140 More than 144 More than 148 More than 152 More than 156 More than 160 More than 164 More than 168 More than 172 More than 176 More than 180 |
450 447 438 414 383 341 277 202 120 34 0 |
Now on the same graph plot the points (140, 450), (144, 447), (148, 438), (152, 414), (156, 383), (160, 341), (164, 277), (168, 202), (172, 120), (176, 34), (180, 0)
The curves intersect at (167, 225).
Hence, 167 is the median.
Mean, Median, Mode of Grouped Data, Cumulative Frequency Graph and Ogive Exercise Ex. 18F
Solution 1

Solution 2
Class having maximum frequency is the modal class.
Here, maximum frequency = 27
Hence, the modal class is 40 - 50.
Thus, the lower limit of the modal class is 40.
Solution 3

Solution 4

Solution 5

Solution 6

Solution 7

Solution 8

Solution 9

Solution 10

Solution 11

Solution 12

Solution 13

Solution 14

Solution 15

Solution 16

Solution 17

Solution 18

Solution 19

Solution 20

Solution 21

Solution 22

Mean, Median, Mode of Grouped Data, Cumulative Frequency Graph and Ogive Exercise MCQ
Solution 1
Correct option: (d)
Range is not a measure of central tendency.
Solution 2
Correct option: (a)
Mean cannot be determined graphically.
Solution 3
Correct option: (a)
Since mean is the average of all observations, it is influenced by extreme values.
Solution 4
Correct option: (c)
Mode can be obtained graphically from a histogram.
Solution 5
Correct option: (d)
Ogives are used to determine the median of a frequency distribution.
Solution 6
Correct option: (b)
The cumulative frequency table is useful in determining the median.
Solution 7
Correct option: (b)
Median is given by the abscissa of the point of intersection of the Less than Type and More than Type cumulative frequency curves.
Solution 8

Solution 9

Solution 10
Correct option: (c)
di's are the deviations from A of midpoints of the classes.
Solution 11
Correct option: (b)
While computing the mean of the grouped data, we assume that the frequencies are centred at the class marks of the classes.
Solution 12
Correct option: (b)
Mode = (3 x median) - (2 x mean)
Solution 13
Correct option: (c)
Since the abscissa of the point of intersection of both the ogives gives the median, we have median = 20.5
Solution 14

Solution 15
Correct option: (c)
Class having maximum frequency is the modal class.
Here, maximum frequency = 30
Hence, the modal class is 30 - 40.
Solution 16

Solution 17

Solution 18
Correct option: (c)
Mean = 8.9
Median = 9
Mode = 3Median - 2Mean
= 3 x 9 - 2 x 8.9
= 27 - 17.8
= 9.2
Solution 19

Solution 20

Solution 21

Solution 22

Solution 23
Correct option: (c)
For a symmetrical distribution, we have
Mean = mode = median
Solution 24
Correct option: (c)
Number of families having income more than Rs. 20000 = 50
Number of families having income more than Rs. 25000 = 37
Hence, number of families having income range 20000 to 25000 = 50 - 37 = 13
Solution 25

Solution 26
Correct option: (d)
Mean of 20 numbers = 0
Hence, sum of 20 numbers = 0 x 20 = 0
Now, the mean can be zero if
sum of 10 numbers is (S) and the sum of remaining 10 numbers is (-S),
sum of 11 numbers is (S) and the sum of remaining 9 numbers is (-S),
…….
sum of 19 numbers is (S) and the 20th number is (-S), then their sum is zero.
So, at the most, 19 numbers can be greater than zero.
Solution 27

Solution 28

Solution 29
(a) - (s)
The most frequent value in a data is known as mode.
(b) - (r)
Mean cannot be determined graphically.
(c) - (q)
An ogive is used to determine median.
(d) - (p)
Standard deviation is not a measure of central tendency.
Solution 30

Solution 31

Mean, Median, Mode of Grouped Data, Cumulative Frequency Graph and Ogive Exercise Test Yourself
Solution 1
Correct option: (b)
The cumulative frequency table is useful in determining the median.
Solution 2
Correct option: (c)
Mean = 27
Median = 33
Mode = 3Median - 2Mean
= 3 x 33 - 2 x 27
= 99 - 54
= 45
Solution 3

Solution 4

Solution 5

Solution 6
Number of athletes who completed the race in less than 14.6 seconds
= 2 + 4 + 15 + 54
= 75
Solution 7

Solution 8
The frequency table is as follows:
|
Classes Profit (in lakhs Rs.) |
Frequency Number of shops |
|
5 - 10 |
2 |
|
10 - 15 |
12 |
|
15 - 20 |
2 |
|
20 - 25 |
4 |
|
25 - 30 |
3 |
|
30 - 35 |
4 |
|
35 - 40 |
3 |
The frequency corresponding to the class 20 - 25 is 4.
Solution 9

Solution 10

Solution 11

Solution 12
Solution 13
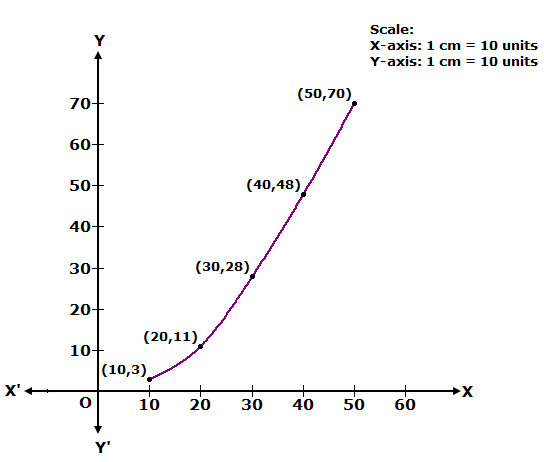
|
Marks |
Less than 10 |
Less than 20 |
Less than 30 |
Less than 40 |
Less than 50 |
|
Number of students |
3 |
11 |
28 |
48 |
70 |
We plot the points (10, 3), (20, 11), (30, 28), (40, 48) and (50, 70) to get the cumulative frequency curve as follows:
Solution 14

Solution 15
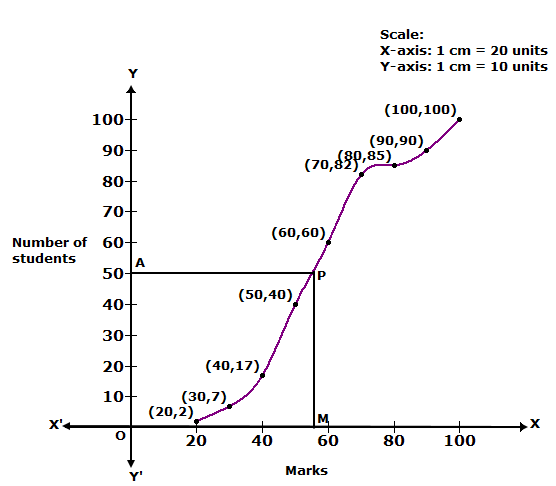
|
Marks obtained |
Less than 20 |
Less than 30 |
Less than 40 |
Less than 50 |
Less than 60 |
Less than 70 |
Less than 80 |
Less than 90 |
Less than 100 |
|
Number of students |
2 |
7 |
17 |
40 |
60 |
82 |
85 |
90 |
100 |
We plot the points (20, 2), (30, 7), (40, 17), (50, 40), (60, 60), (70, 82), (80, 85), (90, 90) and (100, 100) to get the cumulative frequency curve as follows:
![]()
At y = 50, affix A.
Through A, draw a horizontal line meeting the curve at P.
Through P, a vertical line is drawn which meets OX at M.
OM = 56.
Hence, median = 56
Solution 16

Solution 17

Solution 18

Solution 19

Mode :

Solution 20
Less Than Series:
|
Class interval |
Frequency |
|
Less than 10 |
2 |
|
Less than 15 |
14 |
|
Less than 20 |
16 |
|
Less than 25 |
20 |
|
Less than 30 |
23 |
|
Less than 35 |
27 |
|
Less than 40 |
30 |
We plot the points (10, 2), (15, 14), (20, 16), (25, 20), (30, 23), (35, 27) and (40, 30) to get less than ogive.
More Than Series:
|
Class interval |
Frequency |
|
More than 5 |
30 |
|
More than 10 |
28 |
|
More than 15 |
16 |
|
More than 20 |
14 |
|
More than 25 |
10 |
|
More than 30 |
7 |
|
More than 35 |
3 |
We plot the points (5, 30), (10, 28), (15, 16), (20, 14), (25, 10), (30, 7) and (35, 3) to get more than ogive.
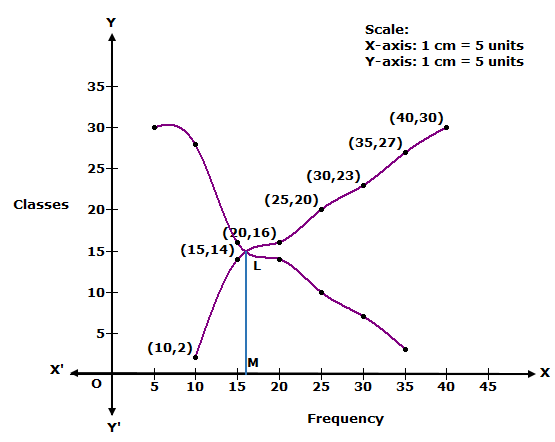
The two curves intersect at L. Draw LM ⊥ OX.
Thus, median = OM = 16
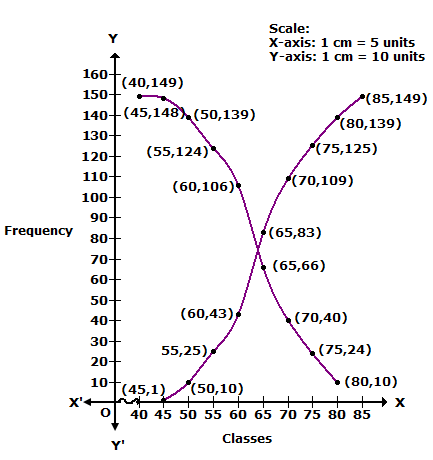
Solution 21
Less Than Series:
|
Class interval |
Frequency |
|
Less than 45 |
1 |
|
Less than 50 |
10 |
|
Less than 55 |
25 |
|
Less than 60 |
43 |
|
Less than 65 |
83 |
|
Less than 70 |
109 |
|
Less than 75 |
125 |
|
Less than 80 |
139 |
|
Less than 85 |
149 |
We plot the points (45, 1), (50, 10), (55, 25), (60, 43), (65, 83), (35, 27), (70, 109), (75, 125), (80, 139) and (85, 149) to get less than ogive.
More Than Series:
|
Class interval |
Frequency |
|
More than 40 |
149 |
|
More than 45 |
148 |
|
More than 50 |
139 |
|
More than 55 |
124 |
|
More than 60 |
106 |
|
More than 65 |
66 |
|
More than 70 |
40 |
|
More than 75 |
24 |
|
More than 80 |
10 |
We plot the points (40, 149), (45, 148), (50, 139), (55, 124), (60, 106), (65, 66), (70, 40), (75, 24) and (80, 10) to get more than ogive.
Solution 22

Mode :

