Class 9 FRANK Solutions Maths Chapter 23 - Graphical Representation of Statistical Data
After learning the basic concepts of Statistics, learn to represent data in graphical format using Frank Solutions for ICSE Class 9 Mathematics Chapter 23 Graphical representation of Statistical Data. Revise the solutions for this chapter to understand the given statistical data and construct a diagram to explain the data visually. The chapter covers construction of bar graphs, double bar graphs, histograms, and frequency polygons.
Use TopperLearning’s Frank textbook solutions to read data from graphs for answering questions. Go ahead and explore our ICSE Class 9 Maths Selina solutions for improving your Math skills. Besides, get conceptual clarity by reviewing the questions and answers in our e-learning portal’s ‘UnDoubt’ section.
Graphical Representation of Statistical Data Exercise Ex. 23.1
Solution 1
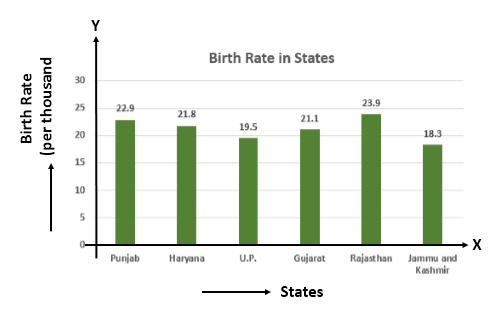
The bar graph is as follows:
Solution 2
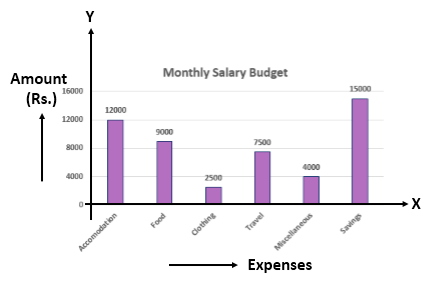
The bar graph is as follows:
Solution 3
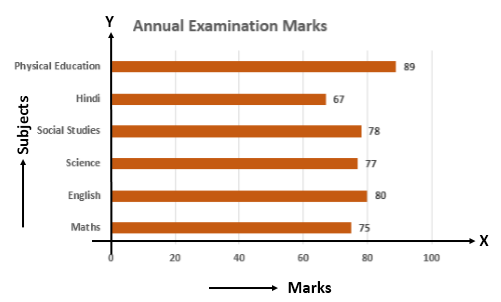
The horizontal bar graph is as follows:
Solution 4
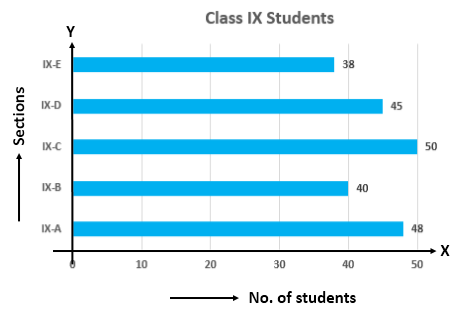
The horizontal bar graph is as follows:
Solution 5
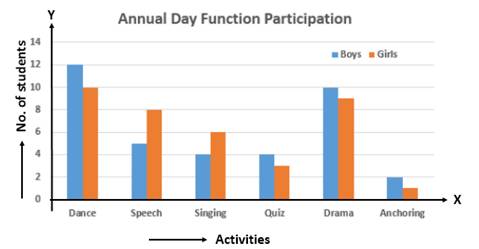
The double bar graph is as follows:
Solution 6
Solution 7

Solution 8
Solution 9
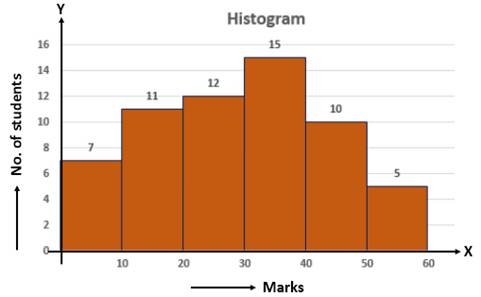
|
Marks |
0 - 10 |
10 - 20 |
20 - 30 |
30 - 40 |
40 - 50 |
50 - 60 |
|
Number of students |
7 |
11 |
12 |
15 |
10 |
5 |
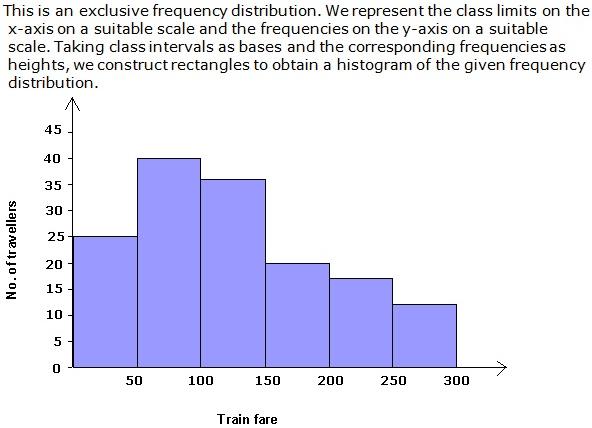
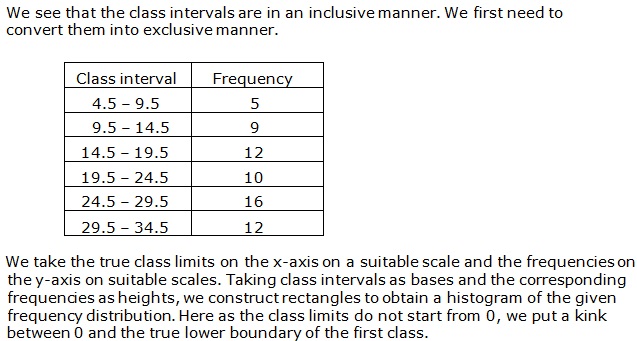
The histogram is as follows:
Solution 10

Solution 11

Solution 12

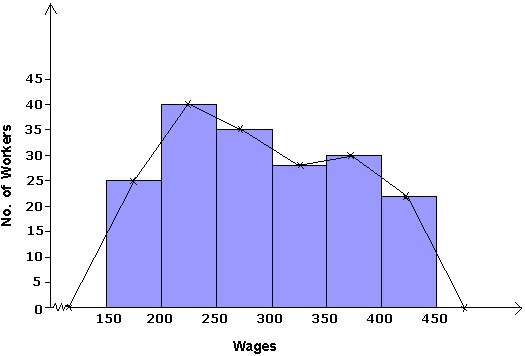
Solution 13

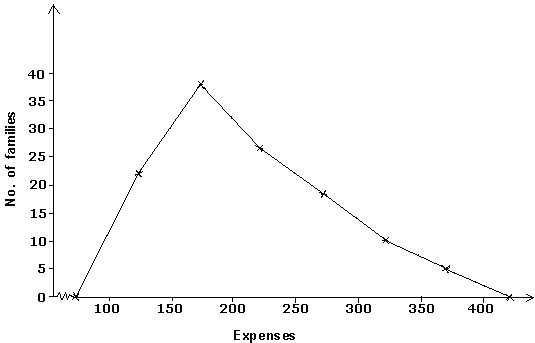
Solution 14
14
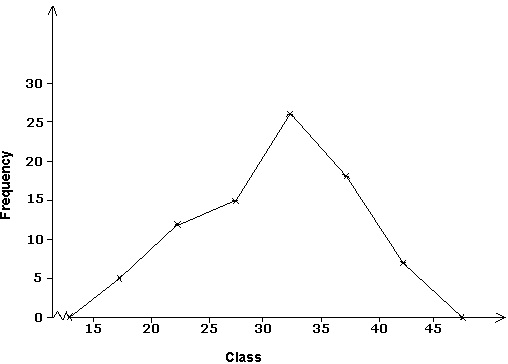
Solution 15
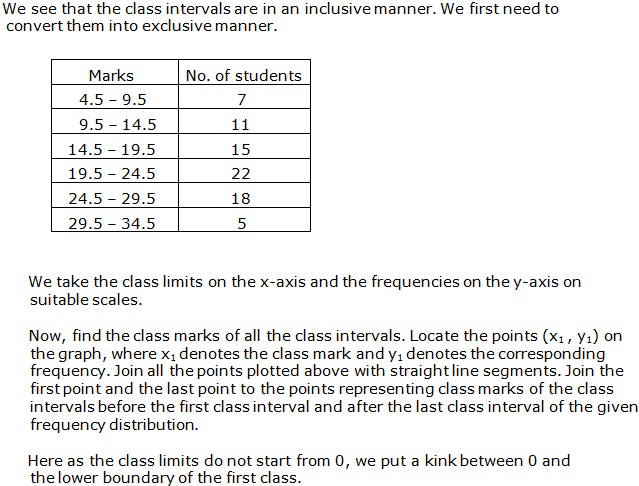
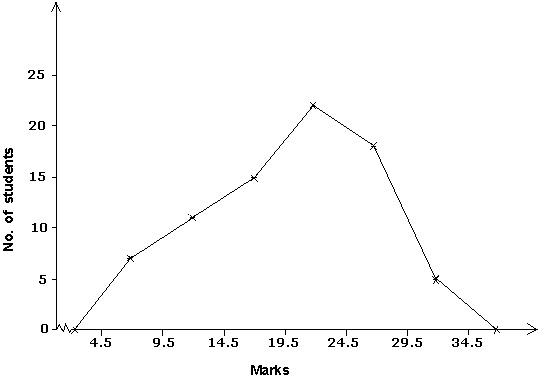
Solution 16
- The information about Production of wheat and sugar (in million tons) in five different states (U.P., Bihar, W.B., M.P., Punjab) is given in the graph.
- Punjab is the largest producer of wheat.
- U.P. is the largest producer of sugar.
- U.P. has total production of wheat and sugar as its maximum.
- W.B. has the total production of wheat and sugar minimum.

