CBSE Class 10 Answered
The following table shows the number of runs scored by a certain batsman in different overs:
Over
50-55
55-60
60-65
65-70
70-75
75-80
No. of runs
2
8
12
24
38
16
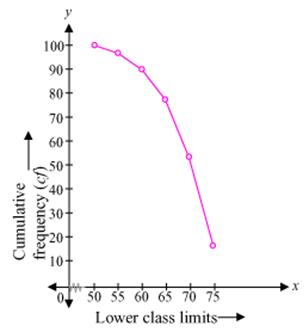
Change the distribution to a "more than" type distribution, and draw its OGIVE on the graph.
Asked by Topperlearning User | 27 Jul, 2017, 04:20: PM
We can obtain cumulative frequency distribution of more than type as following -
|
Over (lower class limits) |
Cumulative frequency |
|
More than or equal to 50 |
100 |
|
More than or equal to 55 |
100 - 2 = 98 |
|
More than or equal to 60 |
98 - 8 = 90 |
|
More than or equal to 65 |
90 - 12 = 78 |
|
More than or equal to 70 |
78 - 24 = 54 |
|
More than or equal to 75 |
54 - 38 = 16 |
Now taking lower class limits on x-axis and their respective cumulative frequencies on y-axis we can obtain its ogive as follows.

Answered by | 27 Jul, 2017, 06:20: PM
Application Videos
Concept Videos
CBSE 10 - Maths
Asked by shoaibkhan87277 | 17 Oct, 2020, 02:58: PM
CBSE 10 - Maths
Asked by mad | 06 Mar, 2019, 03:45: PM
CBSE 10 - Maths
Asked by Topperlearning User | 13 Feb, 2014, 04:58: PM
CBSE 10 - Maths
Asked by Topperlearning User | 25 Feb, 2014, 04:38: PM
CBSE 10 - Maths
Asked by Topperlearning User | 25 Feb, 2014, 04:39: PM
CBSE 10 - Maths
Asked by Topperlearning User | 25 Feb, 2014, 04:47: PM
CBSE 10 - Maths
Asked by Topperlearning User | 13 Feb, 2014, 05:05: PM
CBSE 10 - Maths
Asked by Topperlearning User | 03 Nov, 2017, 10:10: AM
CBSE 10 - Maths
Asked by Topperlearning User | 25 Feb, 2014, 04:28: PM


