
CBSE Class 11-science Answered
The following table represents the age group of employees working in a certain company
Age group
No of people
15-25
25
25-35
54
35-45
34
45-55
20
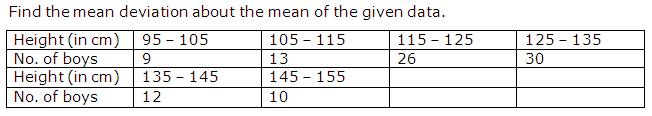
Find the mean deviation about mean.
Asked by Topperlearning User | 16 Nov, 2016, 05:12: AM
|
Age Group |
xi |
No of people fi |
fixi |
|xi-mean| |
fi|xi-mean| |
|
15-25 |
20 |
25 |
500 |
13.684 |
324.1 |
|
25-35 |
30 |
54 |
1620 |
3.684 |
198.936 |
|
35-45 |
40 |
34 |
1360 |
6.316 |
214.744 |
|
45-55 |
50 |
20 |
1000 |
16.316 |
352.32 |

Answered by | 16 Nov, 2016, 07:12: AM
Application Videos
-
Mean Deviation about the Mean
 Finding mean deviation based on the mean of the data
Concept Videos
-
Mean Deviation: Introduction
 This video covers various measures of dispersion, range and mean deviation ...
 -
Mean Deviation
This video covers various measures of dispersion, range and mean deviation ... -
Mean Deviation: Exam Prep Strategies
This video covers various measures of dispersion, range and mean deviation ...
CBSE 11-science - Maths
Asked by Topperlearning User | 12 Aug, 2014, 12:01: PM
CBSE 11-science - Maths
Asked by Topperlearning User | 12 Aug, 2014, 12:06: PM
CBSE 11-science - Maths
Asked by Topperlearning User | 04 Jun, 2014, 01:23: PM
CBSE 11-science - Maths
Asked by Topperlearning User | 04 Jun, 2014, 01:23: PM
CBSE 11-science - Maths
Asked by Topperlearning User | 04 Jun, 2014, 01:23: PM
CBSE 11-science - Maths
Asked by Topperlearning User | 04 Jun, 2014, 01:23: PM
CBSE 11-science - Maths
Asked by Topperlearning User | 15 Nov, 2016, 03:45: AM
CBSE 11-science - Maths
Asked by Topperlearning User | 04 Jun, 2014, 01:23: PM
CBSE 11-science - Maths
Asked by Topperlearning User | 04 Jun, 2014, 01:23: PM
CBSE 11-science - Maths
Asked by Topperlearning User | 15 Nov, 2016, 04:08: AM
