
CBSE Class 9 Answered
The following table gives the distribution of students of two sections according to the marks obtained by them.
Section A
Section B
Mark
Frequency
Marks
Frequency
0 - 10
2
0 - 10
5
10 - 20
12
10 - 20
11
20 - 30
18
20 - 30
15
30 - 40
13
30 - 40
12
40 - 50
5
40 - 50
7
Represent the marks of the students of both the sections on the same graph by two frequency polygons.
Asked by Topperlearning User | 06 Dec, 2013, 01:12: AM
|
Section A |
Section B |
||||
|
Marks |
Class marks |
Frequency |
Marks |
Class marks |
Frequency |
|
0 - 10 |
5 |
2 |
0 - 10 |
5 |
5 |
|
10 - 20 |
15 |
12 |
10 - 20 |
15 |
11 |
|
20 - 30 |
25 |
18 |
20 - 30 |
25 |
15 |
|
30 - 40 |
35 |
13 |
30 - 40 |
35 |
12 |
|
40 - 50 |
45 |
5 |
40 - 50 |
45 |
7 |
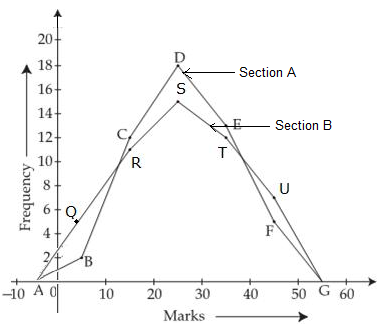
ABCDEFG is the frequency polygon for section A and AQRSTUG is the frequency polygon for section B.
Answered by | 06 Dec, 2013, 03:12: AM
Application Videos

Concept Videos
-
Cumulative Frequency of a particular class-interval ...
 Cumulative Frequency of a particular class-interval. Representation of data...
 -
Cumulative Frequency of a particular class-interval ...
 Cumulative Frequency of a particular class-interval. Representation of data...
 -
Graphical Representation of Data ...
 Cumulative Frequency of a particular class-interval. Representation of dat...
CBSE 9 - Maths
Asked by poortivansh2009 | 26 Dec, 2023, 01:19: PM
CBSE 9 - Maths
Asked by deshmukhsiddhesh39 | 03 Jul, 2020, 03:37: PM
CBSE 9 - Maths
Asked by Topperlearning User | 23 May, 2016, 10:17: AM
CBSE 9 - Maths
Asked by Topperlearning User | 07 Feb, 2014, 01:57: PM
CBSE 9 - Maths
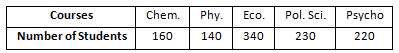 Represent the above data using bar graph.
Asked by Topperlearning User | 04 Jan, 2014, 11:46: AM
CBSE 9 - Maths
Asked by Topperlearning User | 23 May, 2016, 10:20: AM
CBSE 9 - Maths
Asked by Topperlearning User | 18 Aug, 2017, 12:37: PM
CBSE 9 - Maths
Asked by Topperlearning User | 04 Jan, 2014, 11:46: AM
CBSE 9 - Maths
Asked by Topperlearning User | 18 Aug, 2017, 12:37: PM
CBSE 9 - Maths
Asked by Topperlearning User | 18 Aug, 2017, 12:40: PM
