
CBSE Class 9 Answered
The following data gives amount of manure (in thousand tonnes) manufactured by a company during some years:
Years
1992
1993
1994
1995
1996
1997
Manure (in thousand tonnes)
18
35
50
30
40
20
(i) Represent the above data with help of bar graph.
(ii) In which consecutive year/s, the maximum decrease in manure production took place?
Asked by Topperlearning User | 04 Jan, 2014, 11:46: AM
(i)
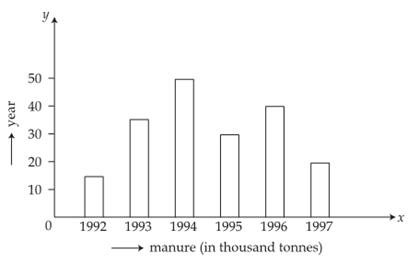
(ii) From the bar graph, it is clear that maximum decrease took place in consecutive years
1994 and 1995
And
1996 and 1997
Answered by | 04 Jan, 2014, 01:46: PM
Application Videos


Concept Videos
-
Cumulative Frequency of a particular class-interval ...
 Cumulative Frequency of a particular class-interval. Representation of data...
 -
Cumulative Frequency of a particular class-interval ...
 Cumulative Frequency of a particular class-interval. Representation of data...
 -
Graphical Representation of Data ...
 Cumulative Frequency of a particular class-interval. Representation of dat...
CBSE 9 - Maths
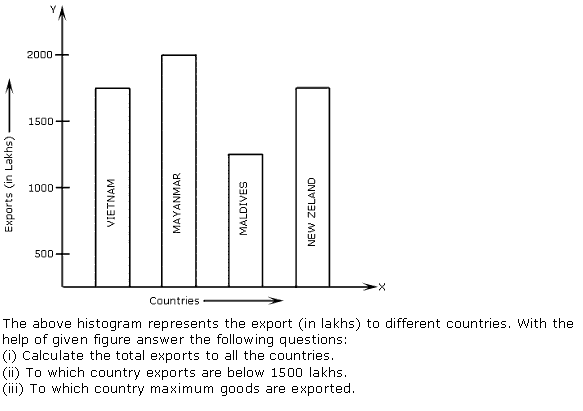
Asked by poortivansh2009 | 26 Dec, 2023, 01:19: PM
CBSE 9 - Maths
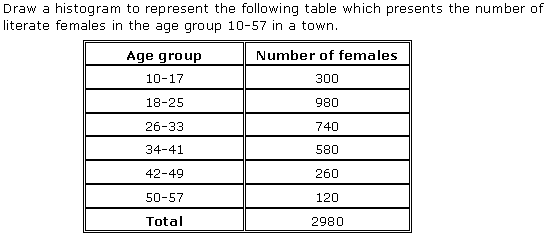
Asked by deshmukhsiddhesh39 | 03 Jul, 2020, 03:37: PM
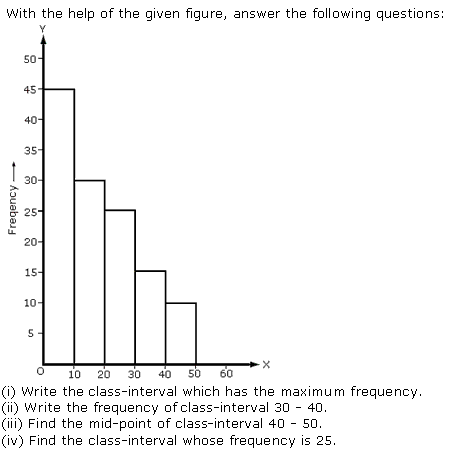
CBSE 9 - Maths
Asked by Topperlearning User | 23 May, 2016, 10:17: AM
CBSE 9 - Maths
Asked by Topperlearning User | 07 Feb, 2014, 01:57: PM
CBSE 9 - Maths
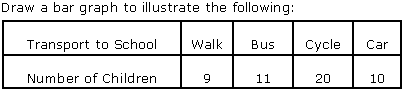
 Represent the above data using bar graph.
Asked by Topperlearning User | 04 Jan, 2014, 11:46: AM
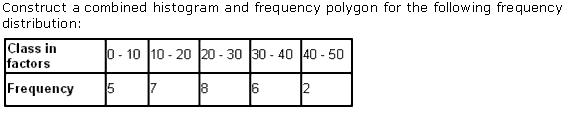
CBSE 9 - Maths
Asked by Topperlearning User | 23 May, 2016, 10:20: AM
CBSE 9 - Maths
Asked by Topperlearning User | 18 Aug, 2017, 12:37: PM
CBSE 9 - Maths
Asked by Topperlearning User | 04 Jan, 2014, 11:46: AM
CBSE 9 - Maths
Asked by Topperlearning User | 18 Aug, 2017, 12:37: PM
CBSE 9 - Maths
Asked by Topperlearning User | 18 Aug, 2017, 12:40: PM
