
CBSE Class 9 Answered
The daily income of 50 doctors is given below:
Daily income (in Rs.)
No. of Doctors
0 - 1000
1000 - 2000
2000 - 3000
3000 - 4000
4000 - 5000
5000 - 6000
8
7
12
6
11
6
Draw a histogram for the above data.
Asked by Topperlearning User | 03 Nov, 2017, 10:15: AM
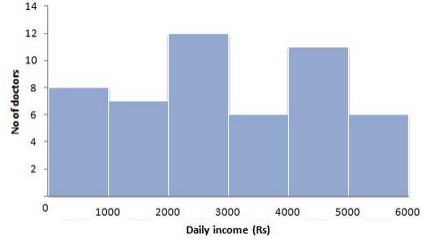
Steps of Construction:
(i) We represent the daily income on the horizontal axis. We choose the scale on horizontal axis as 1 cm = Rs. 1000.
(ii) We represent the number of doctors (frequency) on the vertical axis. Since the maximum frequency is 12, we choose the scale as 1 cm = 2 doctors.
(iii) We now draw rectangles (or rectangular bars) of width equal to the class-size and lengths according to the frequencies of the corresponding class intervals.
Answered by | 03 Nov, 2017, 12:15: PM
Application Videos

Concept Videos
-
Cumulative Frequency of a particular class-interval ...
 Cumulative Frequency of a particular class-interval. Representation of data...
 -
Cumulative Frequency of a particular class-interval ...
 Cumulative Frequency of a particular class-interval. Representation of data...
 -
Graphical Representation of Data ...
 Cumulative Frequency of a particular class-interval. Representation of dat...
CBSE 9 - Maths
Asked by poortivansh2009 | 26 Dec, 2023, 01:19: PM
CBSE 9 - Maths
Asked by deshmukhsiddhesh39 | 03 Jul, 2020, 03:37: PM
CBSE 9 - Maths
Asked by Topperlearning User | 23 May, 2016, 10:17: AM
CBSE 9 - Maths
Asked by Topperlearning User | 07 Feb, 2014, 01:57: PM
CBSE 9 - Maths
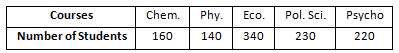 Represent the above data using bar graph.
Asked by Topperlearning User | 04 Jan, 2014, 11:46: AM
CBSE 9 - Maths
Asked by Topperlearning User | 23 May, 2016, 10:20: AM
CBSE 9 - Maths
Asked by Topperlearning User | 18 Aug, 2017, 12:37: PM
CBSE 9 - Maths
Asked by Topperlearning User | 04 Jan, 2014, 11:46: AM
CBSE 9 - Maths
Asked by Topperlearning User | 18 Aug, 2017, 12:37: PM
CBSE 9 - Maths
Asked by Topperlearning User | 18 Aug, 2017, 12:40: PM
