NEET Class neet Answered
Please explain that graph.How to draw graph .Please explain
Asked by valavanvino1011 | 14 Jul, 2019, 09:26: AM
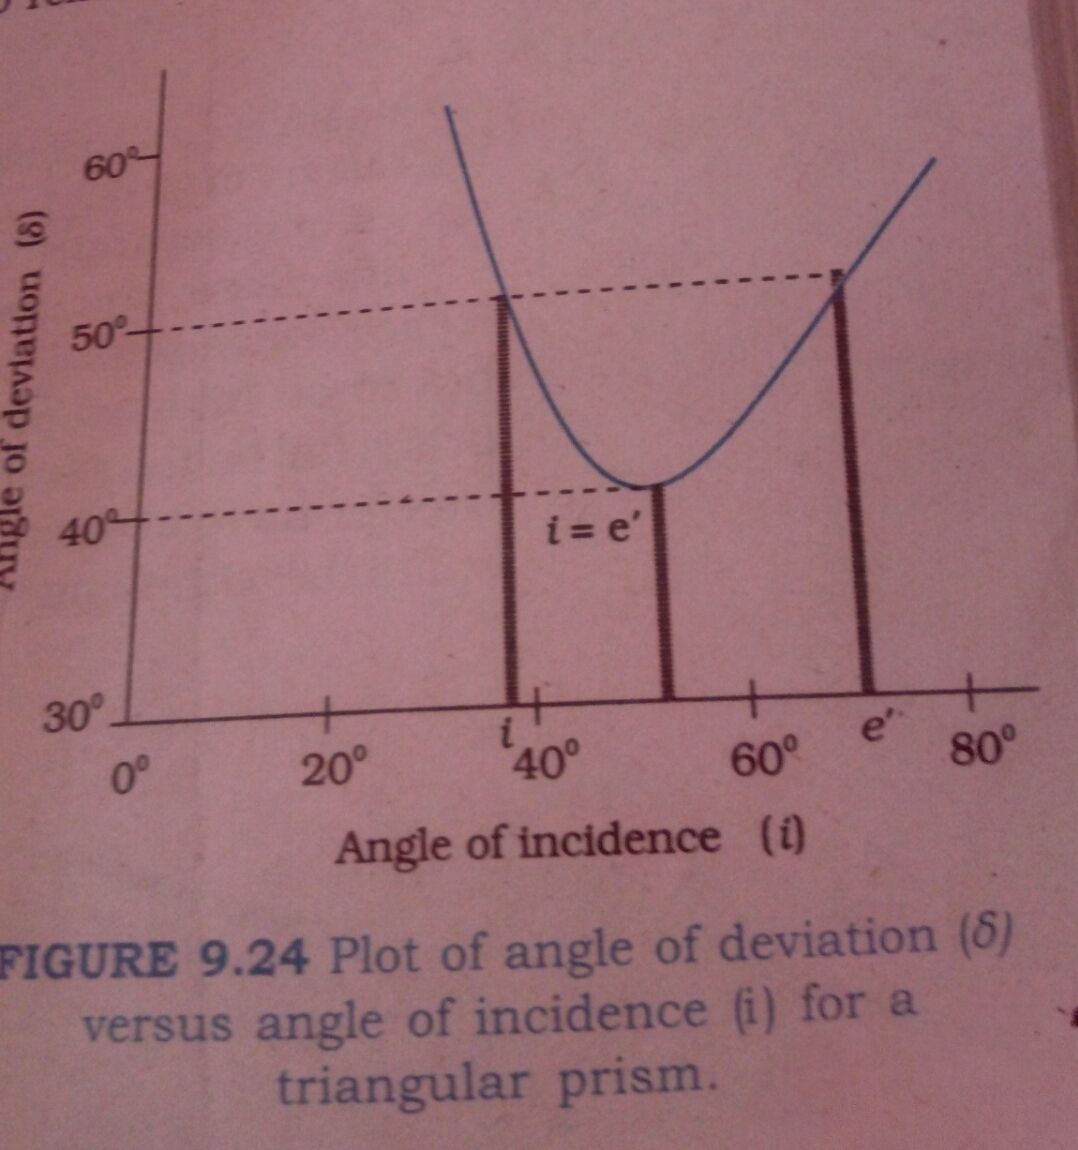
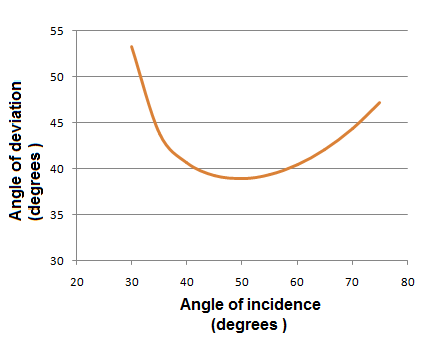
Given graph is showing the variation of angle of deviation with respect to angle of incidence in prism.
The graph can be plotted from experimetally measured angle of deviation for different angle of incidence.
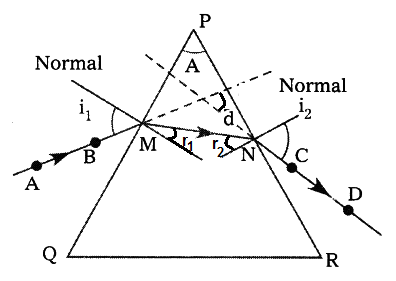
Draw the outline of prism on a paper. draw Normal at M to the side PQ.
draw a line for the incident ray and put two pins on the line as shown as A and B in figure.
put the prism on the marked outline and observe the refracted ray from the side PR .
Put two pins in the direction of emergent ray , shown in figure as C and D.
It is possible to trace the path of incident ray as shown in figure. From the drawn normals at M and N,
it is possible to measure the angles i1 , r1 , r2 and i2 .
Extend the incident and emergent ray to get angle of deviation d as shown in figure.
Hence for a given angle of incidence i1 , we get angles i.e., angle of refraction r1 on first interface PQ ,
angle of incidence r2 at second interface PR, angle of emergence i2 and angle of deviation d .
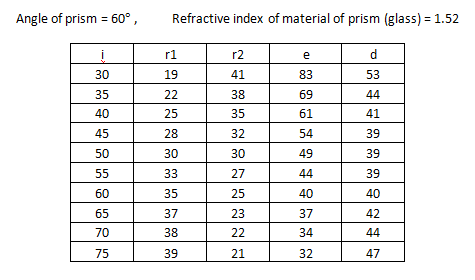
By varying the angle of incidence, we get variation of angle of deviation.
Data of this kind of typical experiment is tabulated below
graph of angle of incidence i Vs angle of deviation d is plotted as shown below
Answered by Thiyagarajan K | 14 Jul, 2019, 11:46: AM
Application Videos
-
Growth of Current in L-R Circuit
 In this video, the growth of current in RL circuit is explained. It include...
NEET neet - Physics
Asked by praveenpriya000079 | 18 Apr, 2024, 07:24: AM
NEET neet - Physics
Asked by gouranshi84 | 17 Apr, 2024, 05:23: PM
NEET neet - Physics
Asked by sojusvi | 17 Apr, 2024, 01:12: PM