
CBSE Class 9 Answered
My doubt is--
Acttually I haven't understood that when we are constructing a histogram, when do we have to find adjusted frequency or frequency density or are they the same things?
Asked by bis0584 | 04 Mar, 2015, 06:31: PM
Histograms are most commonly used for continuous data.
The vertical axis of histogram is labelled as frequency density, which is calculated by

When a histogram with non-uniform (unequal) class widths is to be constructed,
it should be ensured that the areas of the rectangles are proportional to the class frequencies. In this case we need to adjust the frequencies (Adjusted frequency).
Answered by | 04 Mar, 2015, 06:44: PM
Application Videos
-
Algebraic Identities: Quadratic
 This video contains a question which is solved using square of binomials
 -
Factorisation using Square identity
 This video explains factorisation using square identity
 -
Appilcations based problem on Linear Equation in two va ...
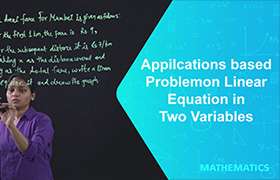 This video explains how to form a linear equation using given statements an...
 -
Application based problem on a Circle -1 ...
 This video contains a problem based on the concept of Circle and its Applic...
 -
Application based problem on a Circle -2 ...
 This video contains a question based on the concept of Circle and its Appli...
Concept Videos
-
Rational Numbers ...
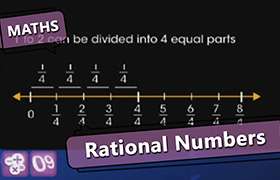 Recall the concept of number line and discuss its importance in day to day...
 -
Irrational Numbers
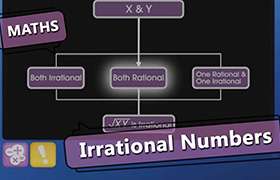 This video explains how to differentiate between rational and irrational nu...
 -
Real Numbers
 This video covers the definition of real numbers, difference between the ra...
 -
Laws of Exponents
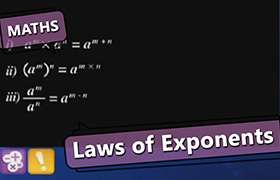 This video explains the statement of the laws of exponents and simplify exp...
 -
Introduction to Polynomials
 This video explains the definition of polynomial and related terms, identif...
CBSE 9 - Maths
Asked by rathorgaurav2945 | 21 Apr, 2024, 10:31: PM
CBSE 9 - Maths
Asked by monika.vns14 | 18 Apr, 2024, 05:15: PM
CBSE 9 - Maths
Asked by gulshanelectronics2017 | 15 Apr, 2024, 05:35: PM
CBSE 9 - Maths
Asked by tripura78839 | 12 Apr, 2024, 09:05: PM
CBSE 9 - Maths
Asked by singhanjali0199 | 12 Apr, 2024, 08:29: PM
CBSE 9 - Maths
Asked by killerstealer593 | 11 Apr, 2024, 07:50: PM
CBSE 9 - Maths

Asked by saee.shinde3069 | 31 Mar, 2024, 10:12: PM
CBSE 9 - Maths
Asked by rathoreraj7296 | 31 Mar, 2024, 08:09: PM
CBSE 9 - Maths
Asked by divyanshibirla037 | 29 Mar, 2024, 03:26: PM
