
CBSE Class 9 Answered
In
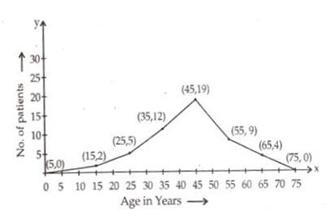
a study of diabetic patients in a village, the following observations were
noted.
Age
in years
10-20
20-30
30-40
40-50
50-60
60-70
Number
of patients
2
5
12
19
9
4
Represent
the above data by a frequency polygon.
Asked by Topperlearning User | 04 Jun, 2014, 01:23: PM
The frequency distribution table with class marks is given below:
|
Class- intervals |
Class marks |
Frequency |
|
0-10 10-20 20-30 30-40 40-50 50-60 60-70 70-80 |
5 15 25 35 45 55 65 75 |
0 2 5 12 19 9 4 0 |
Plot points (5,0), (15,2)………(65, 4) and (75, 0) to get the frequency polygon as follows:
Answered by | 04 Jun, 2014, 03:23: PM
Application Videos


Concept Videos
-
Cumulative Frequency of a particular class-interval ...
 Cumulative Frequency of a particular class-interval. Representation of data...
 -
Cumulative Frequency of a particular class-interval ...
 Cumulative Frequency of a particular class-interval. Representation of data...
 -
Graphical Representation of Data ...
 Cumulative Frequency of a particular class-interval. Representation of dat...
CBSE 9 - Maths
Asked by poortivansh2009 | 26 Dec, 2023, 01:19: PM
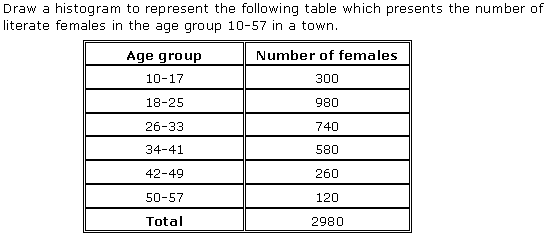
CBSE 9 - Maths
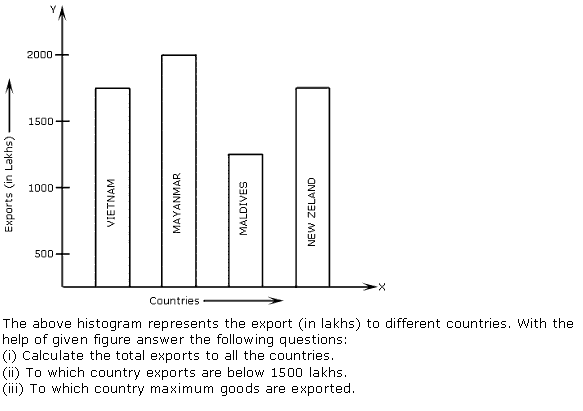
Asked by deshmukhsiddhesh39 | 03 Jul, 2020, 03:37: PM
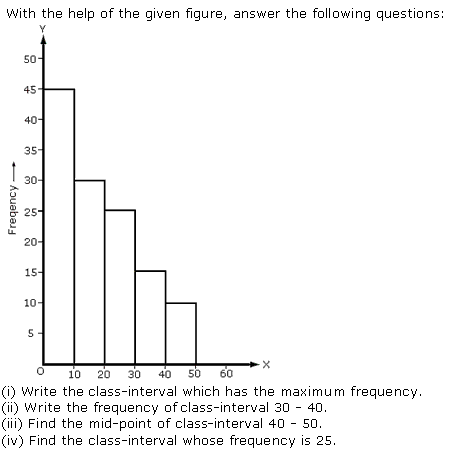
CBSE 9 - Maths
Asked by Topperlearning User | 23 May, 2016, 10:17: AM
CBSE 9 - Maths
Asked by Topperlearning User | 07 Feb, 2014, 01:57: PM
CBSE 9 - Maths
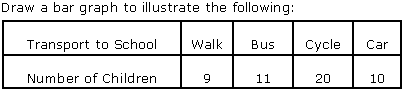
 Represent the above data using bar graph.
Asked by Topperlearning User | 04 Jan, 2014, 11:46: AM
CBSE 9 - Maths
Asked by Topperlearning User | 23 May, 2016, 10:20: AM
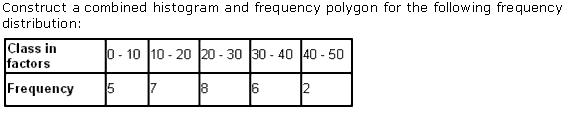
CBSE 9 - Maths
Asked by Topperlearning User | 18 Aug, 2017, 12:37: PM
CBSE 9 - Maths
Asked by Topperlearning User | 04 Jan, 2014, 11:46: AM
CBSE 9 - Maths
Asked by Topperlearning User | 18 Aug, 2017, 12:37: PM
CBSE 9 - Maths
Asked by Topperlearning User | 18 Aug, 2017, 12:40: PM
