ICSE Class 9 Answered
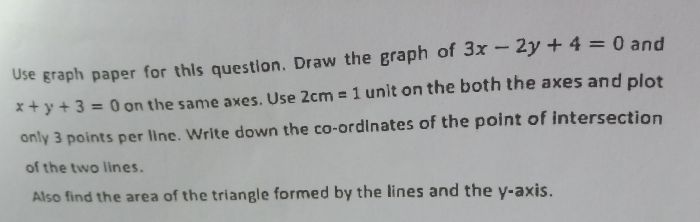
How to draw a graph when there are two simultaneous equations with both x and y generating big numbers. How to hold the graph within the single page? Example question 3x =35y+56 and 3x=5-16y. The numbers generated for these equations contain wide range of numbers and cannot be easily plotted to scale within a small graph page. How to plot suhc numbers within a small graph page?
Asked by Suneel | 11 Sep, 2017, 08:04: PM
Hi,
We understood your query. Generally, graphs which include wide range of numbers will not be asked in your exam.
But in such cases, if you have data on X-axis as 1140, 1560, 3589,...... and so on, then you can take points as 1000, 1500, 2000 and approximately plot the coordinates.
ALternately, if you have no data from 0 to 1000 and then you have data such as 1140, 1210,... and so on, then you can draw a kink (jagged line) on X-axis.
It represents that there is no data from 0 to 1000 and you are starting from 1000, 1100, 1200 and so on.
Hope this clarifies your doubt.
Topperlearning.com
Answered by Rashmi Khot | 12 Sep, 2017, 10:24: AM
Application Videos
-
Appilcations based problem on Linear Equation in two va ...
 This video explains how to form a linear equation using given statements an...
 -
Solution of Linear Equations in two variables graphical ...
 This video explains how to draw the graph of a linear equation and to find ...
Concept Videos
-
Graphical Solution
 Graphical Solution, Graphical Solution of Simultaneous Linear Equations
 -
Graphical Solution
 Graphical Solution, Graphical Solution of Simultaneous Linear Equations
 -
Graphical Solution
 Graphical Solution, Graphical Solution of Simultaneous Linear Equations