CBSE Class 9 Answered
 Which graph represents the following case:
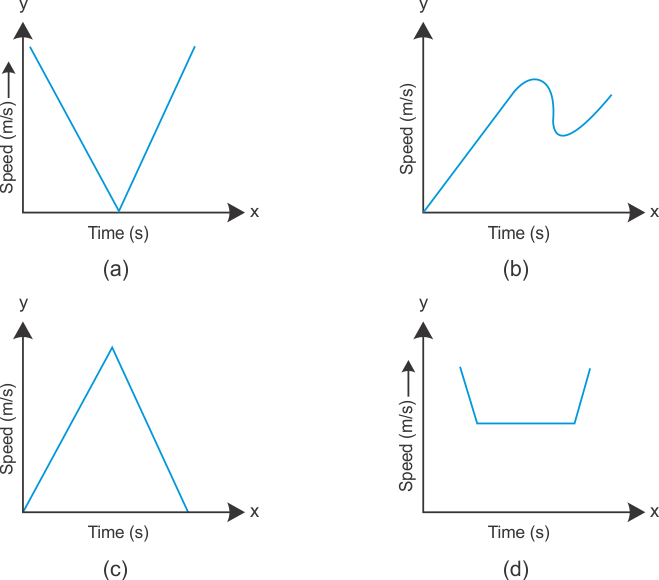
(a) A ball thrown vertically upwards and returning to the hand of the thrower?
(b) A body decelerating to a constant speed and then accelerating?
Which graph represents the following case:
(a) A ball thrown vertically upwards and returning to the hand of the thrower?
(b) A body decelerating to a constant speed and then accelerating?-
Graph (a) represents the case of a ball thrown vertically upwards and returning to the hand of the thrower. At t = 0 speed is maximum. The speed decreases at a constant rate and becomes zero. The ball then falls with a uniform acceleration till its speed becomes equal to the speed of projection.
-
Graph (d) represents deceleration of the body to some constant speed and then accelerating after some time.
Application Videos
-
speed time graph
 This video describes the velocity-time graph numericals
 -
Relation between velocity and displacement in displacem ...

This video explains a case study question based on relation between velo...
-
Relation between uniform and non-uniform acceleration

This video explains a case study question based on relation between unif...
-
Relation between velocity vs time graph

This video explains a case study question based on relation between unif...
-
Interpretation and application of velocity vs time grap ...

This video explains the case study based question based on Interpretatio...