
ICSE Class 9 Answered
explain the velocity-time graph with an example.
Asked by Vijaya | 06 Sep, 2017, 07:09: PM
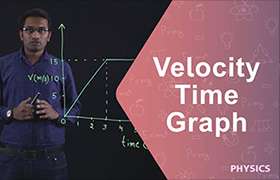
- Velocity time graph is a simple graph which represents increase in time along the positive x axis and increasing velocities along the positive y axis.
- If at time t=2 secs the velocity was 5 m/s, then the cordinates of this instance is (2,5)
- Similarly, if the motion continues to grow at 12 m/s at time t=7 secs, then the cordinate of this instance is (7,12)
- Velocity time graph is the graph which is obtained by joining such points which explains the nature of motion with change in velocities along with their corresponding change in time.
Please click the below link to get an example from the solution of a similar question:
Hope this helped :)
Answered by Abhijeet Mishra | 06 Sep, 2017, 07:24: PM
Application Videos
-
velocity-time graph
 This video describes the calculation of force acting on a particle using th...
 -
speed time graph
 This video describes the velocity-time graph numericals
Concept Videos
-
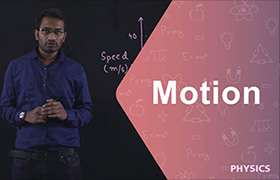
Motion
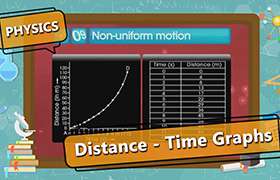
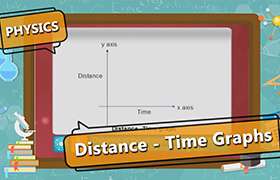 Interpret and calculate the slope of distance. Time graphs for a body in u...
 -
Motion
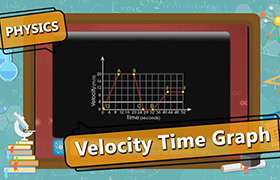
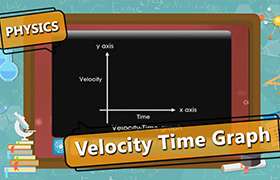 Interpret and calculate the slope of velocity. Time graphs for a body in u...
 -
Motion
 Interpret and calculate the slope of distance. Time graphs for a body in u...
 -
Motion
 Interpret and calculate the slope of velocity. Time graphs for a body in u...
 -
Motion
 Interpret and calculate the slope of distance. Time graphs for a body in u...
ICSE 9 - Physics
Asked by konnojukalyani473 | 21 Feb, 2022, 08:08: PM
ICSE 9 - Physics
Asked by shyluraja21 | 04 Oct, 2021, 04:32: PM
ICSE 9 - Physics
Asked by anuprajgarhia | 07 Jul, 2020, 07:38: PM
ICSE 9 - Physics
Asked by aeishnaparihar4259.9sdatl | 06 May, 2020, 11:46: AM
ICSE 9 - Physics
Asked by lalithariharan14 | 05 Jul, 2019, 12:21: PM
