
CBSE Class 12-commerce Answered
Explain indifference map with diagram.
Asked by Topperlearning User | 25 Apr, 2016, 11:03: AM
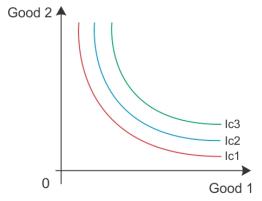
Indifference map refers to a set of indifference curves. An indifference curve which is to the right and above another shows a higher level of satisfaction to the consumer. Here, IC3 shows higher level of satisfaction than IC2. Thus, the indifference curve relates to a higher level of income of the consumer.
Answered by | 25 Apr, 2016, 01:03: PM
CBSE 12-commerce - Microeconomics
Asked by Topperlearning User | 25 Apr, 2016, 11:03: AM
CBSE 12-commerce - Microeconomics
Asked by Topperlearning User | 25 Apr, 2016, 11:03: AM
CBSE 12-commerce - Microeconomics
Asked by Topperlearning User | 25 Apr, 2016, 11:03: AM
CBSE 12-commerce - Microeconomics
Asked by Topperlearning User | 25 Apr, 2016, 11:03: AM
CBSE 12-commerce - Microeconomics
Asked by Topperlearning User | 25 Apr, 2016, 11:03: AM
CBSE 12-commerce - Microeconomics
Asked by Topperlearning User | 25 Apr, 2016, 11:03: AM
CBSE 12-commerce - Microeconomics
Asked by Topperlearning User | 25 Apr, 2016, 11:03: AM
CBSE 12-commerce - Microeconomics
Asked by Topperlearning User | 25 Apr, 2016, 11:03: AM
CBSE 12-commerce - Microeconomics
Asked by Topperlearning User | 25 Apr, 2016, 11:03: AM
CBSE 12-commerce - Microeconomics
Asked by Topperlearning User | 25 Apr, 2016, 11:03: AM
