CBSE Class 12-science Answered
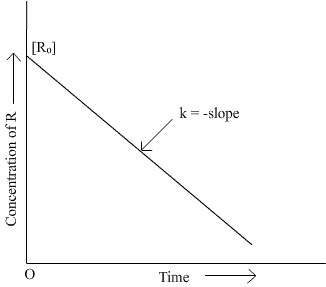
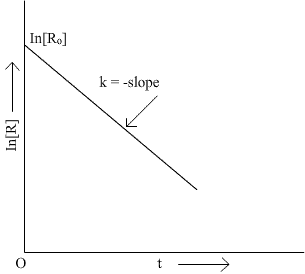
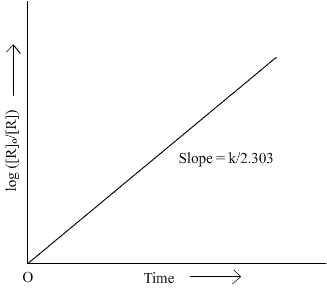
Draw schematic graphs showing the following details of the first order reactions.i) Variation of the rate of reaction with change in the concentration of the reactant. ii) Variation of In [R] Vs t and Log [Ro]/[R] vs t.
Asked by Topperlearning User | 28 Mar, 2014, 10:48: AM


Answered by | 28 Mar, 2014, 12:48: PM
Concept Videos
CBSE 12-science - Chemistry
Asked by amitkumar.cis | 14 Jan, 2021, 12:40: PM
CBSE 12-science - Chemistry
Asked by Topperlearning User | 04 Jun, 2014, 01:23: PM
CBSE 12-science - Chemistry
Asked by Topperlearning User | 28 Mar, 2014, 10:16: AM
CBSE 12-science - Chemistry
Asked by Topperlearning User | 04 Jun, 2014, 01:23: PM
CBSE 12-science - Chemistry
Asked by Topperlearning User | 04 Jun, 2014, 01:23: PM
CBSE 12-science - Chemistry
Asked by Topperlearning User | 22 Jun, 2016, 09:20: AM
CBSE 12-science - Chemistry
Asked by Topperlearning User | 04 Jun, 2014, 01:23: PM
CBSE 12-science - Chemistry
Asked by Topperlearning User | 04 Jun, 2014, 01:23: PM
CBSE 12-science - Chemistry
Asked by Topperlearning User | 22 Jun, 2016, 09:17: AM
CBSE 12-science - Chemistry
Asked by Topperlearning User | 22 Jun, 2016, 09:18: AM


