CBSE Class 11 Commerce Statistics For Economics Free Doubts and Solutions
CBSE - XI Commerce - Statistics for Economics
From the following table , draw Lorenz curve for number of persons in Group A and B and interpret the result. Profit Earned 20 30 40 50 60 No. of persons(Group A) 6 8 10 12 14 No. of persons(group B) 15 10 9 11 5
CBSE - XI Commerce - Statistics for Economics
What is the significance ofof statistic in economics
CBSE - XI Commerce - Statistics for Economics
-0.9561
CBSE - XI Commerce - Statistics for Economics
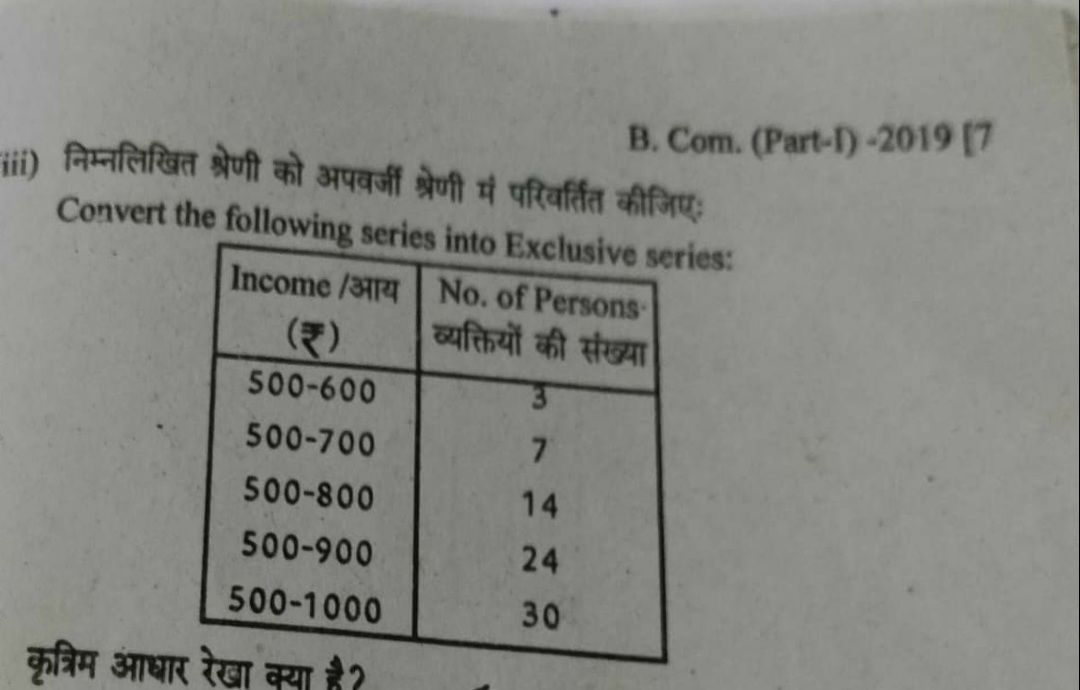
Prepare a frequency distribution of the marks obtained out of 100 for the following observations: (Prepare both Exclusive Method and Inclusive Method) 15 45 40 42 50 60 62 68 70 42 75 75 80 81 25 26 31 32 78 45 31 45 42 43 55 56 78 80 81 62 60 62 58 69 70 45 50 56 72 58 75 62 62 65 60 70 35 37 40 55
CBSE - XI Commerce - Statistics for Economics
from the following paragraph prepare a frequency table of the number of the letters in a word ignoring the punctuation marks "by statistics
CBSE - XI Commerce - Statistics for Economics
What is primary data
CBSE - XI Commerce - Statistics for Economics
formit of mean mode median
CBSE - XI Commerce - Statistics for Economics - Presentation of Data
In some examples of my statistics book in the chapter arithmetic line graphs and time series graphs, the first year on the X axis has been taken to be at the origin (see attached). However in some other examples the first year on the X axis has been taken to be after the origin. Which way is correct?