
CBSE Class 9 Answered
 Can you please tell me is the answer is correct or not? If not please tell why. This question is from-
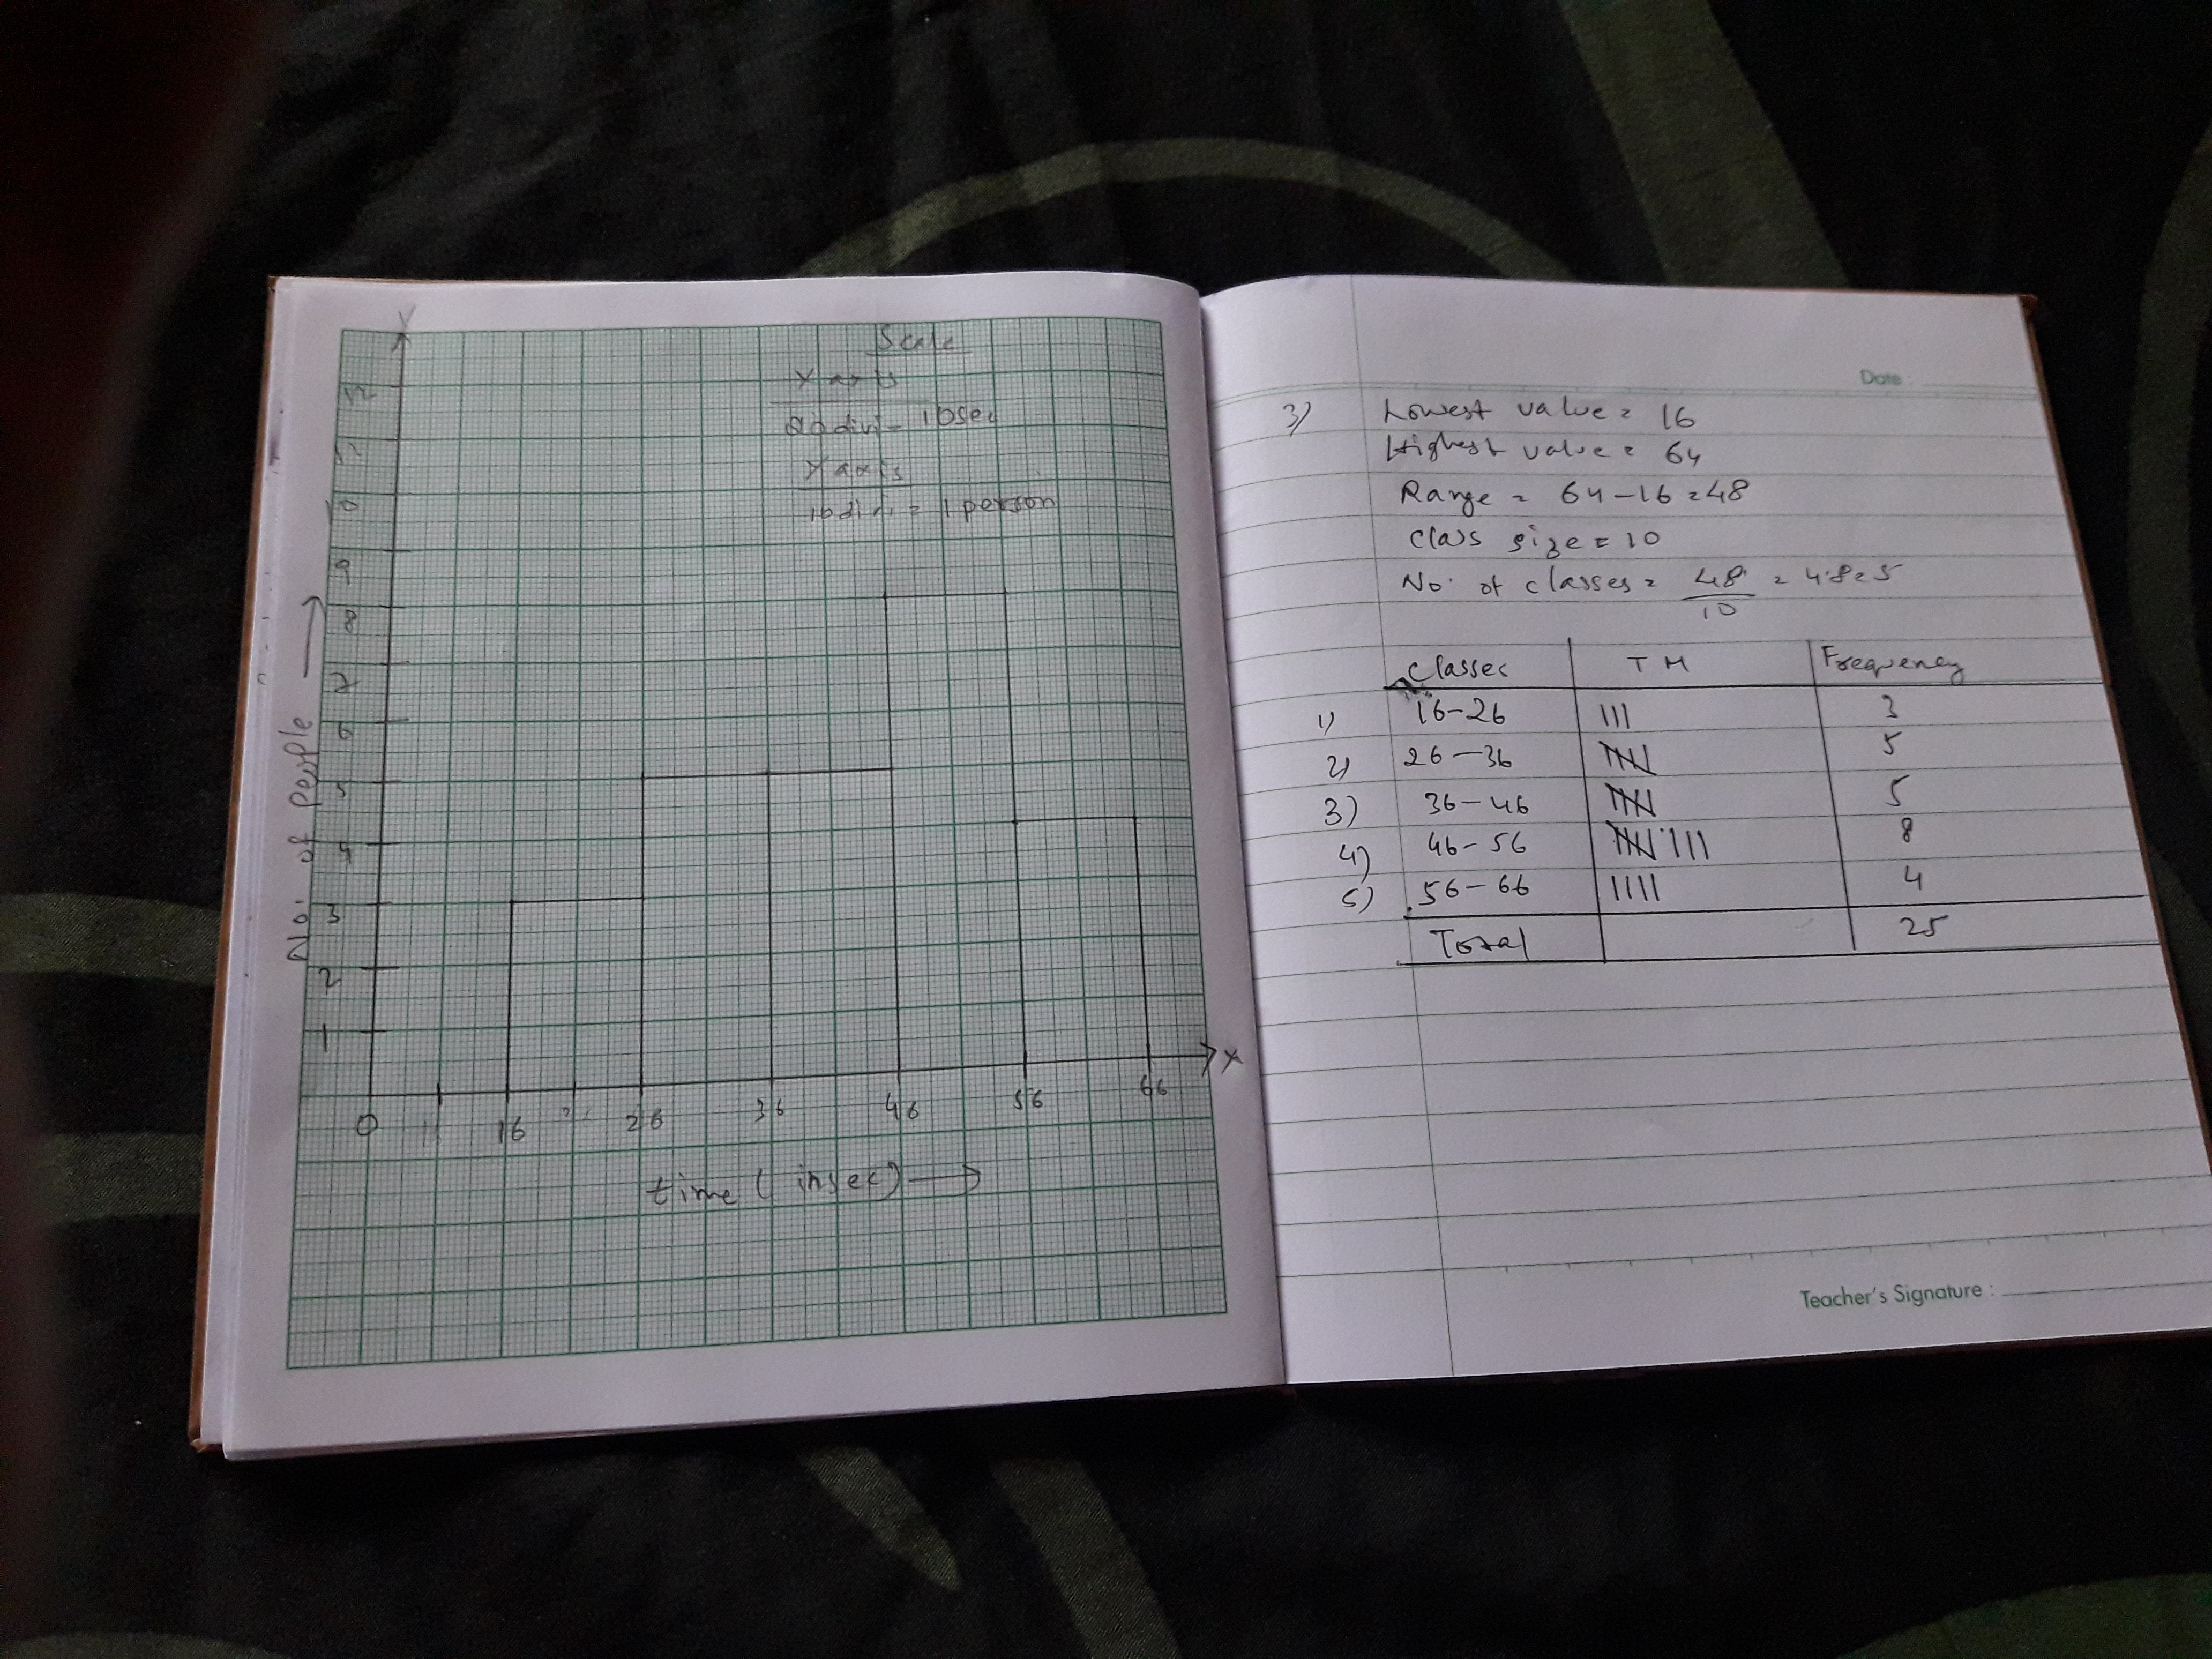
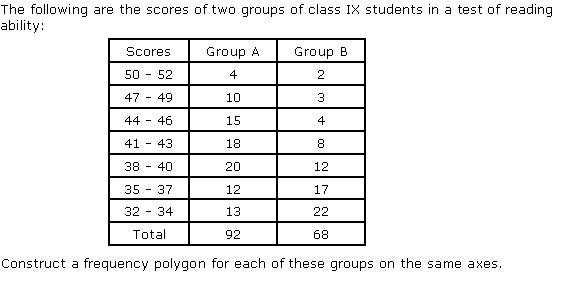
R.D.Sharma Ch-Graphical representation of statistical data, Exercise-23.3
Question no. - 3
Asked by banerjee_milky | 08 Sep, 2017, 01:11: PM
Yes, the answer is correct.
However, you need to add the kink(break) mark on the x axis near the origin as the graph begins at 16 and not at 0.
Scale isn't very clear. It should be:
2 cm=10 seconds on X axis
1 cm= 1 pupil on Y axis
Answered by Nooren | 08 Sep, 2017, 02:03: PM
Application Videos


Concept Videos
-
Cumulative Frequency of a particular class-interval ...
 Cumulative Frequency of a particular class-interval. Representation of data...
 -
Cumulative Frequency of a particular class-interval ...
 Cumulative Frequency of a particular class-interval. Representation of data...
 -
Graphical Representation of Data ...
 Cumulative Frequency of a particular class-interval. Representation of dat...
CBSE 9 - Maths
Asked by poortivansh2009 | 26 Dec, 2023, 01:19: PM
CBSE 9 - Maths
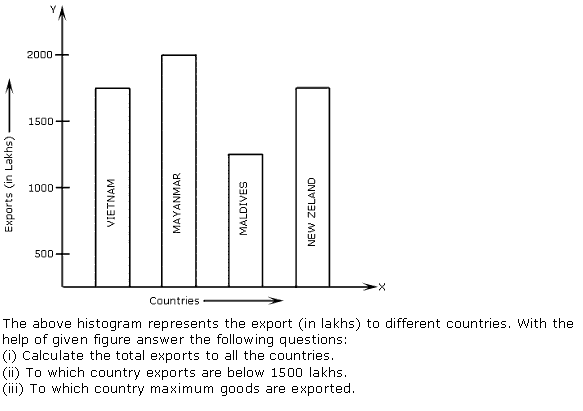
Asked by deshmukhsiddhesh39 | 03 Jul, 2020, 03:37: PM
CBSE 9 - Maths
Asked by Topperlearning User | 23 May, 2016, 10:17: AM
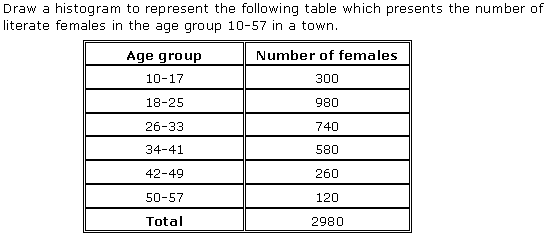
CBSE 9 - Maths
Asked by Topperlearning User | 07 Feb, 2014, 01:57: PM
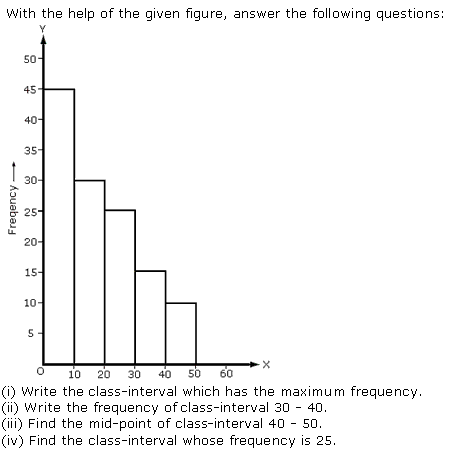
CBSE 9 - Maths
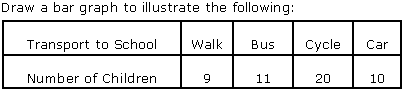
 Represent the above data using bar graph.
Asked by Topperlearning User | 04 Jan, 2014, 11:46: AM
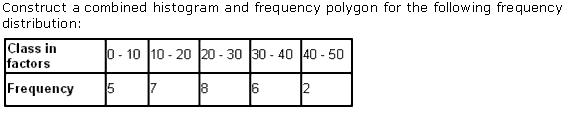
CBSE 9 - Maths
Asked by Topperlearning User | 23 May, 2016, 10:20: AM
CBSE 9 - Maths
Asked by Topperlearning User | 18 Aug, 2017, 12:37: PM
CBSE 9 - Maths
Asked by Topperlearning User | 04 Jan, 2014, 11:46: AM
CBSE 9 - Maths
Asked by Topperlearning User | 18 Aug, 2017, 12:37: PM
CBSE 9 - Maths
Asked by Topperlearning User | 18 Aug, 2017, 12:40: PM
