
CBSE Class 11-science Answered
can we check using dimensional analysis that the area under the v-t graph gives us the displacment and the slope of the v-t graph gives us the accerleration .
i am not understanding the
Asked by Suresh | 02 Jul, 2019, 08:18: PM
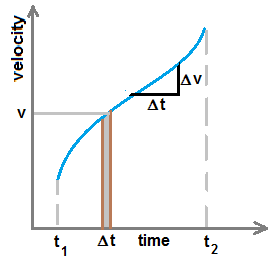
Figure shows the velocity-time graph between time t1 and t2 . Let us consider a small time interval Δt and v be the velocity during this time interval.
Then area under the curve in this time interval = v×Δt
Area under the curve during different time interval between t1 and t2 is given by, Area =  ........................... (1)
........................... (1)where vi are magnitude of velocities at different time interval.
If we do dimensional analysis for RHS of eqn.(1), then dimension of v×Δt = ( L / T ) (T) = (L)
Hence Area under v-t curve has dimension of length. Hence Area under the v-t curve gives displacement.
figure shows the slope of v-t graph, slope = Δv / Δt ........................(2)
Dimensional analysis of RHS of eqn.(2) gives, dimension of slope = ( L/T ) / T = L/T2 ..............(3)
i.e., dimension of slope of v-t graph is same as that of acceleration.
Hence slope of v-t graph gives acceleration.
Answered by Thiyagarajan K | 02 Jul, 2019, 09:00: PM
CBSE 11-science - Physics
Asked by sheikhsaadat24 | 17 Apr, 2024, 09:41: PM
CBSE 11-science - Physics
Asked by sy123946 | 07 Apr, 2024, 04:23: PM
CBSE 11-science - Physics
Asked by derhebha955 | 03 Apr, 2024, 09:03: AM
CBSE 11-science - Physics
Asked by sumedhasingh238 | 29 Mar, 2024, 05:15: PM
CBSE 11-science - Physics
Asked by sumedhasingh238 | 28 Mar, 2024, 11:10: PM
CBSE 11-science - Physics
Asked by roshnibudhrani88 | 23 Mar, 2024, 05:52: PM
CBSE 11-science - Physics
Asked by emad.amd | 21 Mar, 2024, 12:00: PM
CBSE 11-science - Physics
Asked by vinitdubey7735 | 14 Mar, 2024, 11:21: AM
CBSE 11-science - Physics
Asked by om636694 | 04 Mar, 2024, 09:10: PM
CBSE 11-science - Physics
Asked by rajuinwati12 | 04 Mar, 2024, 09:22: AM
