CBSE Class 8 Maths Frequency Distribution
- 2+4
- The number of children in 20 families of a locality are: 2, 2, 3, 1, 1, 2, 3, 2, 2, 1, 2, 2, 3, 1, 2, 1, 1, 3, 2, 2 State the frequency of each observation.
- A dice was thrown 30 times and following outcomes were noted: 2, 1, 2, 4, 6, 1, 2, 3, 6, 5, 4, 4, 3, 1, 1, 3, 1, 1, 5, 6, 6, 2, 2, 3, 4, 2, 5, 5, 6, 4 Prepare a frequency distribution and state which number had the highest frequency?
- 60 students sat for a test. The frequency distribution is shown in the following table: Marks Frequency 0 1 1 3 2 6 3 9 4 8 5 11 6 8 7 7 8 4 9 1 10 2 How many students scored 5 or more marks?
- The weights (in kg) of 35 persons are given below: 43, 51, 47, 62, 48, 40, 50, 62, 53, 56, 40, 48, 56, 53, 50, 42, 55, 52, 48, 46, 45, 54, 52, 50, 47, 44, 54, 55, 60, 63, 58, 55, 60, 58, 53. Prepare a grouped continuous frequency distribution table taking equal class size.
- The following data represent scores of 50 students in a calculus test. 72 72 93 70 59 78 74 65 73 80 57 67 72 57 83 76 74 56 68 67 74 76 79 72 61 72 73 76 67 49 71 53 67 65 100 83 69 61 72 68 65 51 75 68 75 66 77 61 64 74 Prepare the continuous grouped frequency distribution table.
- The daily earnings (in rupees) of 24 stores in a market was recorded as under: 715, 650, 685, 550, 573, 530, 610, 525, 742, 680, 736, 524, 500, 585, 723, 545, 532, 560, 580, 545, 625, 630, 645, 700 Prepare a continuous grouped frequency table taking equal class sizes.
- Given below are the heights ( in cm) of 11 boys of a class: 146, 143, 148, 132, 128, 139, 140, 152, 154, 142, 149. Arrange the above data in ascending order and find: (i) The height of the tallest boy. (ii) The height of the shortest boy. (iii) The range of the given data.
-
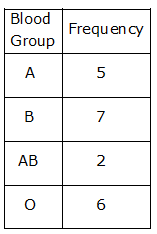
 (1) Which blood group has the most donors?
(2) How many donors are of the ‘O’ blood group?
-
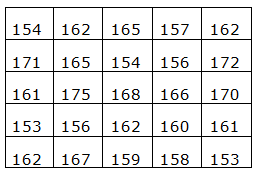
The heights of 25 students, measured to the nearest centimeters have been found to be as follows:
 Represent the above data by a grouped frequency distribution table using tally marks.


