
CBSE Class 6 Maths Pictographs

- picto graph
-
answer
-
Use the following pictograph to answer the following questions:
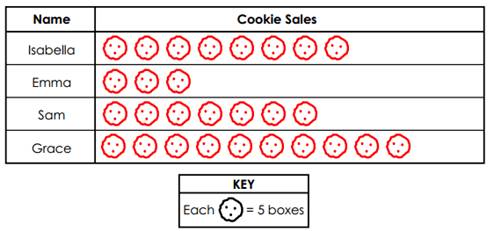 (a) Number of boxes sold by Sam. (b) Number of boxes sold by Emma.
-
The table shown below represents the number of votes for different ice-cream flavor.
Ice-cream Flavor
Number of votes
Chocolate
8
Vanilla
7
Chocolate chip
13
Cookie Dough
8
Strawberry
5
Represent the data in the form of pictograph, by using the key.
-
In the following graph if
 Write the corresponding table.
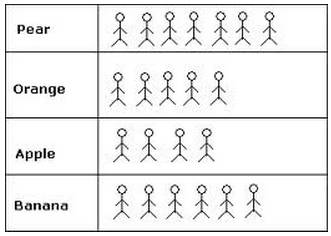
-
Following table shows the sale of car in a car showroom.
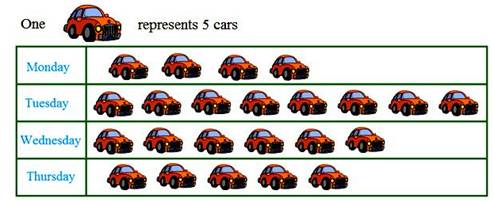 Read the graph and answer the questions: (a) Number of cars sold on Monday. (b) On which day minimum sale happened?
-
There is a pictograph showing rainfall in cm of different cities named (A, B, C, D, E and F) during the current year. On the basis of this pictograph, answer the following questions.
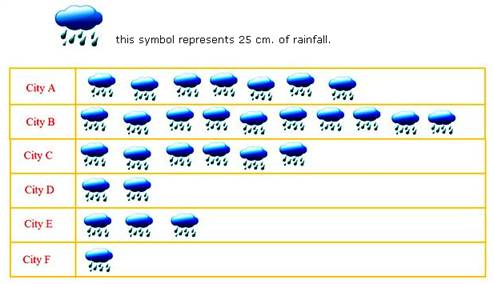 1. In which city did maximum rainfall occur?2. In which city did minimum rainfall occur?3. The city A recorded how much more rainfall than the city F.
- In a school, class-wise number of students is given below: Class I II III IV V No. of students 70 70 60 50 40 Make a pictograph to represent the above data.
- A bookseller sold 60 books on Monday, 50 books on Tuesday, 80 books on Wednesday, 40 books on Thursday, 40 books on Friday and 70 books on Saturday. Draw a pictograph for the books sold during the week.
- A fruit seller sold the following number of different fruits as given below. Form a pictograph with the help of the given data. Fruits Apple Banana Guava Pineapple No. of fruits sold 50 40 60 60
