CBSE Class 11-science Answered
The Second Derivative Test evaluates concavity.
The Second Derivative Test tells you whether a function is concave up or concave down.
Concave Up (CU) - on an interval, the graph of the function lies above all of the tangent lines.
Concave Down (CD) on an interval, the graph of a function lies below all of the tangent lines.
If the second derivative of a function is greater than zero, for all x in an interval, the original graph is concave up.
If the derivative second of a function is less than zero, for all x in an interval, the original graph is concave down.
Points of Inflection show where a graph changes concavity.
Points of Inflection occur where the second derivative of a function equals zero or does not exist, when x is in the domain.
The Second Derivative Test states:
If the value of the critical number of the first derivative equals zero and the second derivative is greater than zero, then the original function has a local minimum at that point.
If the value of the critical number of the first derivative equals zero and the second derivative is less than zero, then the original function has a local maximum at that point.
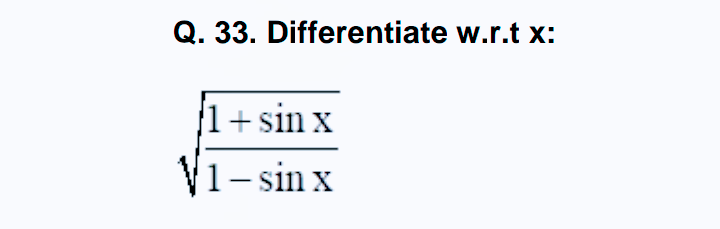
Example: Find the points of inflection and determine the functions concavity.
f(x) = x3-3x2+x-2
f' (x) =3x2-6x+1
f'' (x) = 6x-6
= 6(x-1)
0= 6(x-1)
x=1
Substitute the x-value back into the original function to determine the order pair of the point of inflection.
f(1)=(1)3-3(1)2+(1)-2
f (1) = -3
Therefore, a point of inflection occurs at the point (1, -3).
To determine concavity, create a chart of intervals including the point of inflection x-value.
Choose a value within each interval and recognize whether the answer is negative of positive.
Negative values mean the graph is concave down on an interval.
Positive values mean the graph is concave up on an interval.
|
Function |
Second Derivative |
Conclusion |
|
(-infinity, 1) |
Negative |
Concave Down |
|
(1, infinity) |
Positive |
Concave Up |
Therefore, concluding from the chart, from the interval (-infinity, 1) the graph is concave down and from the interval (1, infinity) the graph is concave up.
Kindly draw the graph accordingly.
Concept Videos
-
...
 This video explains the intuitive idea of limit of a function, rules of alg...
 -
Limit of rational functions
 This video covers examples related to finding the limit of rational functio...
 -
Limits of Trigonometric Functions
 This video explains the use of sandwich/Squeeze Theorem to find the limit a...
 -
Meaning of Derivatives
 This video explains derivatives as rate of change of distance function and ...
 -
Derivative of linear combination of functions using con ...
 Derivative of linear combination of functions using constant multiple, sum ...