
CBSE Class 9 Answered
What is the use of a d-t graph and a v-t graph ?
Asked by | 05 Sep, 2009, 11:39: AM
They represent the kinematic information of an object in motion, graphically.
If d vs t graph can show at times the object was moving faster, what's the time when it moved with fastest of the speed and so on. We can calculate the instantaneous velocity by tangent at any point of t, to the curve, and hence we can construct v vs t graph.
Similarly v vs t graph shows how much acceleration is there, the amount of accleration/deceleration can be found from the slope at various points on the v vs t graph, and we can plot a vs t.
Also net area gives the displacement under the curve from given time limits while the total area gives the distance travelled by the object.
Regards,
Team,
TopperLearning.
Answered by | 05 Sep, 2009, 02:02: PM
Application Videos
-
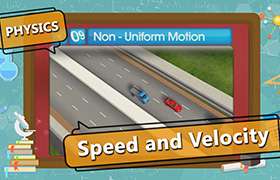
speed of body in uniform circular motion ...
 This video decribes the speed of a body in uniform circular motion.
 -
Distance and displacement_0
 This video describes the difference netween distance covered and displaceme...
 -
distance and displacement_2
 This video describes the displacement covered by a body during its journey.
 -
second equation of motion
 This video explains the relation between velocity and displacement
 -
first equation of motion ...
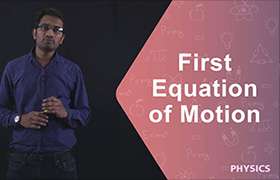 This video describes the relation between velocity and acceleration
Concept Videos
-
Motion
 Define acceleration and retardation in context with uniform and non-unifor...
 -
Motion
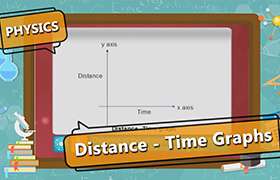 Interpret and calculate the slope of distance. Time graphs for a body in u...
 -
Motion
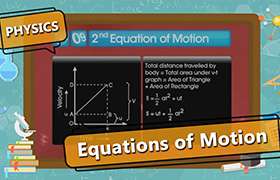 Derive and apply the three equations of motion using velocity-time graph f...
 -
Motion
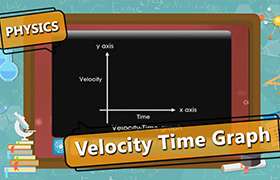 Interpret and calculate the slope of velocity. Time graphs for a body in u...
 -
Motion
 Define speed, velocity, average speed and average velocity in context with ...
CBSE 9 - Physics
Asked by mailtoparvathyprajith | 06 Feb, 2024, 09:50: PM
CBSE 9 - Physics
Asked by mailtoparvathyprajith | 06 Feb, 2024, 09:10: PM
CBSE 9 - Physics
Asked by sapnamantri05 | 24 Nov, 2023, 04:54: PM
CBSE 9 - Physics
Asked by ashrithpandu84 | 09 Oct, 2023, 08:09: PM
CBSE 9 - Physics
Asked by janhavisoni2099 | 02 Oct, 2023, 05:20: PM
CBSE 9 - Physics
Asked by durgesh21332 | 06 Sep, 2023, 06:17: PM
CBSE 9 - Physics
Asked by sagrawal0081 | 18 Aug, 2023, 05:04: PM
CBSE 9 - Physics
Asked by ketkiparasgandhi | 05 Jul, 2023, 08:02: PM
CBSE 9 - Physics
Asked by leena3732 | 15 Jun, 2023, 09:42: AM
