
CBSE Class 8 Answered
The table shown below represents the number of votes, given by a set of students, for different ice-cream flavor.
Ice-cream Flavor
Number of votes
Chocolate
8
Vanilla
7
Chocolate chip
13
Cookie Dough
8
Strawberry
5
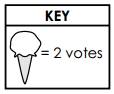
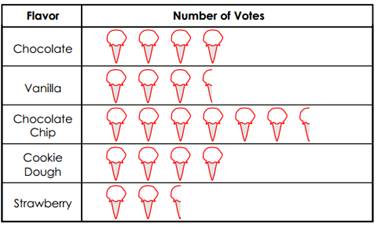
Represent the data in the form of pictograph, by using the key:
Asked by Topperlearning User | 04 Jun, 2014, 01:23: PM
The required pictograph is as below:
Answered by | 04 Jun, 2014, 03:23: PM
Application Videos

Concept Videos

CBSE 8 - Maths
Asked by raju MILI | 26 Mar, 2020, 08:11: PM
CBSE 8 - Maths
Asked by raju MILI | 23 Mar, 2020, 01:48: PM
CBSE 8 - Maths
 (a) How many cookie boxes were sold by Sam?
(b) How many cookie boxes were sold by Emma?
(a) How many cookie boxes were sold by Sam?
(b) How many cookie boxes were sold by Emma?Asked by Topperlearning User | 04 Jun, 2014, 01:23: PM
CBSE 8 - Maths
Asked by Topperlearning User | 04 Jun, 2014, 01:23: PM
CBSE 8 - Maths
Asked by Topperlearning User | 04 Jun, 2014, 01:23: PM
CBSE 8 - Maths
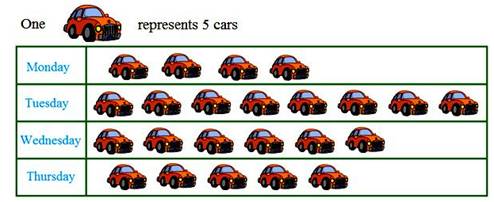 Read the graph and answer the following questions.
(a) How many cars were sold on Monday?
(b) Name the day having maximum sales.
Read the graph and answer the following questions.
(a) How many cars were sold on Monday?
(b) Name the day having maximum sales.Asked by Topperlearning User | 04 Jun, 2014, 01:23: PM
CBSE 8 - Maths
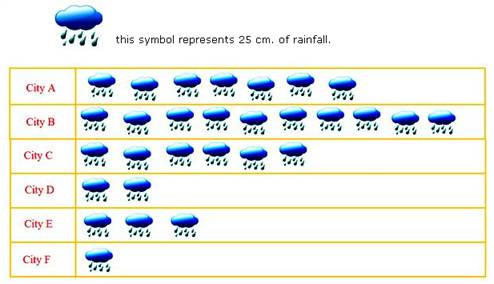 1. In which city was the rainfall maximum?
2. In which city was the rainfall minimum?
3. The city A recorded how much more rainfall than the city F?
1. In which city was the rainfall maximum?
2. In which city was the rainfall minimum?
3. The city A recorded how much more rainfall than the city F?Asked by Topperlearning User | 04 Jun, 2014, 01:23: PM
CBSE 8 - Maths
Asked by Topperlearning User | 04 Jun, 2014, 01:23: PM
CBSE 8 - Maths
Asked by Topperlearning User | 04 Jun, 2014, 01:23: PM
CBSE 8 - Maths
Asked by Topperlearning User | 04 Jun, 2014, 01:23: PM
