
CBSE Class 7 Answered
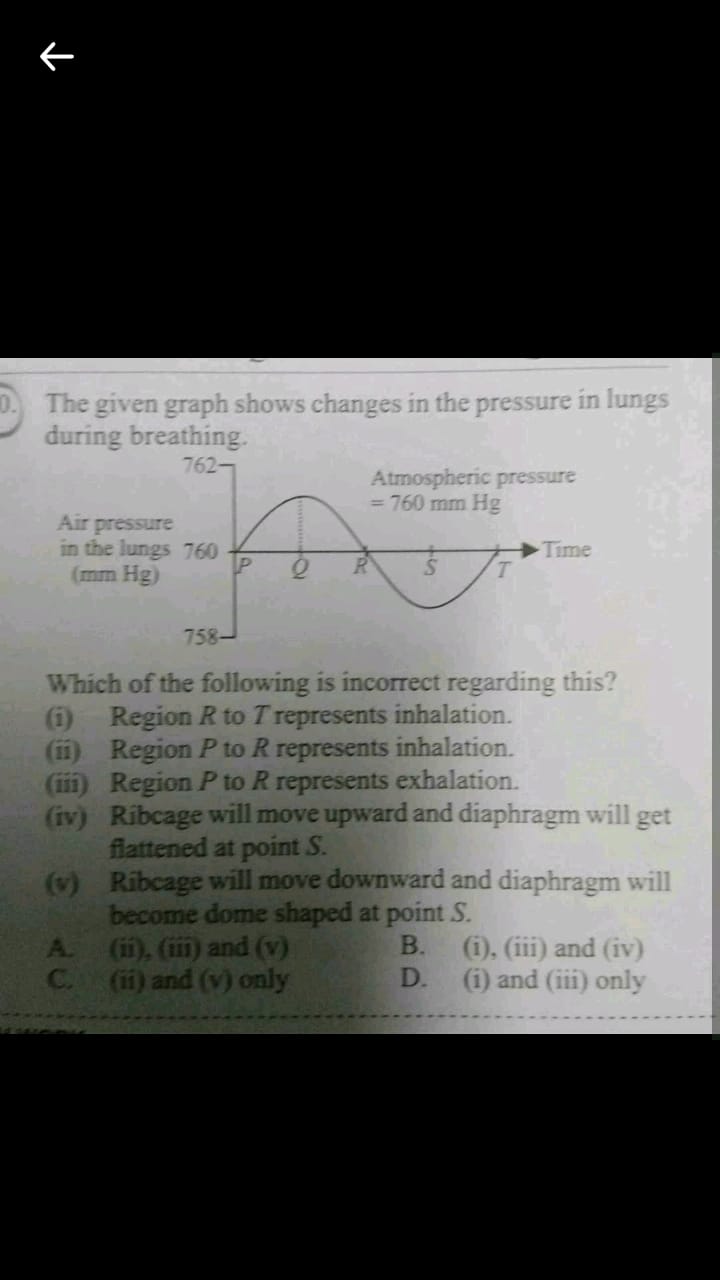
The given graph shows changes in the pressure in lungs during breathing.
Asked by sahooarupkumar3 | 05 Oct, 2018, 01:07: PM
Answer. C, only (ii) and (v) are incorrect
Breathing in humans follow Boyle's Law i.e the pressure of a gas is inversely proportional to its volume: If volume increases, pressure decreases. So, in the graph,
For option (ii), the pressure is decreasing and the volume of air increases in the lungs which is the phenomenon of the start of air giving out (exhalation). This is explained by The process of exhalation occurs due to an elastic recoil of the lung tissue which causes a decrease in volume, resulting in increased pressure in comparison to the atmosphere; thus, air rushes out of the airway.
Now it is clearly known that the graph shows an inhalation graph. So, in inhalation, the lung volume expands as a result of the contraction of the diaphragm and intercostal muscles (the muscles that are connected to the rib cage), thus expanding the thoracic cavity.
For option (v), upon inhalation, the diaphragm contracts and flattens and the chest cavity enlarges.
So, these two are wrong statements.
Answered by Sivanand Patnaik | 06 Oct, 2018, 08:09: PM
Concept Videos
-
Respiration
 Human respiratory system and the process
CBSE 7 - Science
Asked by radhikacharanrajm | 11 Jan, 2023, 07:47: PM
CBSE 7 - Science
Asked by bhumeemahajan36.7 | 26 Dec, 2022, 07:10: PM
CBSE 7 - Science
Asked by akritisingh032009 | 27 Sep, 2021, 11:57: AM
CBSE 7 - Science
Asked by drrrajendrantyr | 20 Jul, 2019, 09:12: PM
CBSE 7 - Science
Asked by ms22071997 | 11 Jul, 2019, 04:14: PM
CBSE 7 - Science
Asked by Pooja12agrawal | 30 Jun, 2019, 05:13: PM
CBSE 7 - Science
Asked by nikhil.chaudhary | 26 Feb, 2019, 12:42: AM
CBSE 7 - Science
Asked by sahooarupkumar3 | 05 Oct, 2018, 01:07: PM
CBSE 7 - Science
Asked by dipalidhorajiya1983 | 16 Aug, 2018, 06:57: AM
