
CBSE Class 12-science Answered
Question is :
Asked by spuneet23 | 16 Oct, 2010, 11:27: AM
Dear Student,
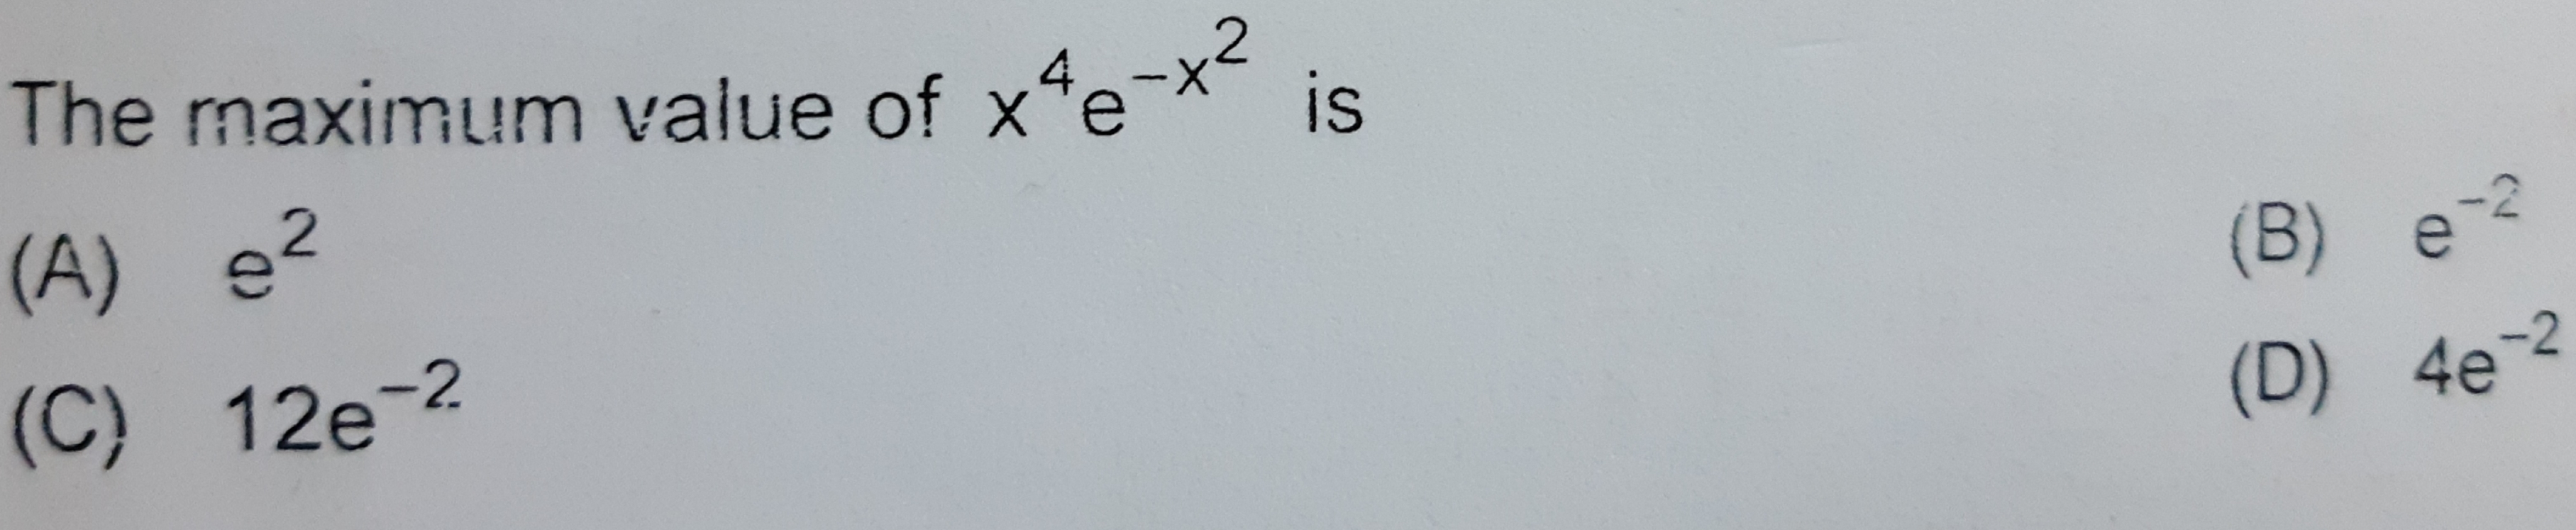
Ans is (A)
If you draw a graph between x and f(x)
f(x) = 0 when x =2, at higher values of x it will approach 1.
f(x) = -1 when x = 1;
f(x) = 1 when x = 1/2;
Now the function will fluctuate too rapidly as x decreases.
If you see values of f(x) for the following values you can judge the patter:
f(1/4) = 1
f(1/5) = -1
f(1/6) = 1
This explains the answer
Regards,
Answered by | 19 Oct, 2010, 12:19: PM
Concept Videos
-
Determine the rate of change of quantities using deriva ...
 Learn to apply the derivative of a function to determine the rate of change...
 -
Increasing & Decreasing Functions
 Learn and check the techniques of using derivative to find the intervals i...
 -
Equation of tangents and normal to a curve at a point ...
 Understand equation of tangents and normal to a curve at a point, angle bet...
 -
Maxima and Minima using first derivative test ...
 This video covers examples and concepts related to algebraic and trigonomet...
 -
Finding local maximum and minimum of a function
 Concept of differential calculus in finding local maximum and minimum of th...
CBSE 12-science - Maths
Asked by srisrinivasa.mcrl | 04 Feb, 2024, 10:39: AM
CBSE 12-science - Maths
Asked by shubh31122006 | 23 Dec, 2023, 02:27: PM
CBSE 12-science - Maths
Asked by lailavafra08 | 26 Oct, 2023, 07:24: PM
CBSE 12-science - Maths
Asked by saisidh05 | 04 Jul, 2022, 03:04: PM
CBSE 12-science - Maths
Asked by agarwalgolu318 | 13 Aug, 2020, 08:09: PM
CBSE 12-science - Maths
Asked by jeevasankar123456 | 17 Jul, 2020, 05:14: PM
CBSE 12-science - Maths
Asked by givduf | 11 Jul, 2020, 09:00: AM
CBSE 12-science - Maths
Asked by clbalaji.cnhalli | 05 Feb, 2020, 08:30: PM
CBSE 12-science - Maths
Asked by Ronitupadhyay13 | 20 Dec, 2019, 12:28: AM
CBSE 12-science - Maths
Asked by dineshchem108 | 09 Oct, 2019, 07:04: PM
