
CBSE Class 9 Answered
 Study the graph and answer the following questions:
In the given graph, in which year was the wheat production minimum?
In which year did India experience the highest production of wheat?
What trends of wheat production does this graph show?
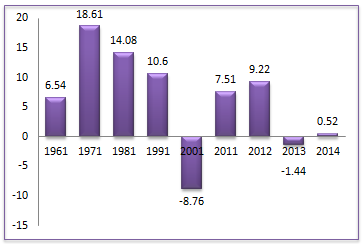
Study the graph and answer the following questions:
In the given graph, in which year was the wheat production minimum?
In which year did India experience the highest production of wheat?
What trends of wheat production does this graph show?
Asked by Topperlearning User | 08 Aug, 2014, 11:15: AM
- According to the statistics shown in the graph, India’s wheat production was minimum in 2001.
- Wheat production in India was maximum in 1971.
- The graph shows that wheat production in India is fluctuating.
Answered by | 08 Aug, 2014, 01:15: PM
Application Videos
-
Food Security. Dimensions of food security
 This video explains what is food security and the major dimensions of food...
 -
Concepts- Issue price, MSP, Buffer Stock
 This video explains the concepts of concepts- Issue price, MSP, Buffer Stoc...
 -
Food Corporation of India and its functions ...
 This video discusses about Food Corporation of India and its functions
 -
Dimesions of hunger
 This video discusses the two dimesions of hunger and Mentions the factors...
 -
Know how to solve Assertion and Reason based Question ...
 Know how to solve Assertion and Reason based Question
CBSE 9 - Economics
Asked by Topperlearning User | 25 Jun, 2014, 03:47: PM
CBSE 9 - Economics
Asked by Topperlearning User | 25 Jun, 2014, 03:47: PM
CBSE 9 - Economics
Asked by Topperlearning User | 25 Jun, 2014, 03:47: PM
CBSE 9 - Economics
Asked by Topperlearning User | 25 Jun, 2014, 03:47: PM
CBSE 9 - Economics
Asked by Topperlearning User | 25 Jun, 2014, 03:47: PM
CBSE 9 - Economics
Asked by Topperlearning User | 25 Jun, 2014, 03:47: PM
CBSE 9 - Economics
Asked by Topperlearning User | 25 Jun, 2014, 03:47: PM
CBSE 9 - Economics
Asked by Topperlearning User | 05 Oct, 2015, 01:19: PM
CBSE 9 - Economics
Asked by Topperlearning User | 25 Jun, 2014, 03:47: PM
CBSE 9 - Economics
Asked by Topperlearning User | 08 Aug, 2014, 11:15: AM
