CBSE Class 9 Answered
How to draw the graph of the linear equation 3x+4y=6 . At what point the graph cuts x axis and y axis
Asked by | 16 Jan, 2012, 05:58: PM
To draw the graph first we make the point table for the equation 3x+4y =6.
To obtain the points, put y = 0, we get x = 3x = 6 or x = 2, so the point is (2, 0).
put, y = 3, we get 3x + 12 = 6 or, 3x = -6 or, x = -2, so the point is (-2, 3).
put x = 0, we get 4y = 6 or, y = 6/4 = 3/2 = 1.5, so the point is (0, 1.5).
Now plot the points (2,0), (-2,3) and (0, 1.5) and join them.
To obtain the points where this line cut x and y axis, observe the points on grapg where
the line cut x and y axis. The coordinate of these points are the reqd. point.
you may observe that the points are (2,0) and (0,1.5).
Answered by | 17 Jan, 2012, 09:34: AM
Application Videos
-
Coordinate Geometry - 1
This video explains a case study based question on finding the coordinat...
Concept Videos
-
Cartesian Plane ...
 This video explains the basic concepts of Coordinate Geometry, discusses qu...
 -
Concepts of Coordinate Geometry
 Understand the basic concepts of Coordinate Geometry and discuss quadrants ...
 -
Basic concepts of Coordinate Geometry
 Understand the basic concepts of Coordinate Geometry and discuss quadrants ...
CBSE 9 - Maths
Asked by mailtoparvathyprajith | 04 Mar, 2024, 09:53: AM
CBSE 9 - Maths
Asked by masinenisriharsha | 23 Oct, 2021, 08:58: PM
CBSE 9 - Maths
Asked by adarsh.sharma1042 | 28 Aug, 2021, 07:27: AM
CBSE 9 - Maths
Asked by rohitmitali07 | 07 Jun, 2021, 07:30: PM
CBSE 9 - Maths
Asked by amritabaraily74 | 21 May, 2021, 05:38: PM
CBSE 9 - Maths
Asked by pvnathan | 24 Mar, 2021, 09:22: AM
CBSE 9 - Maths
Asked by ubarua269 | 24 Aug, 2020, 05:38: PM
CBSE 9 - Maths
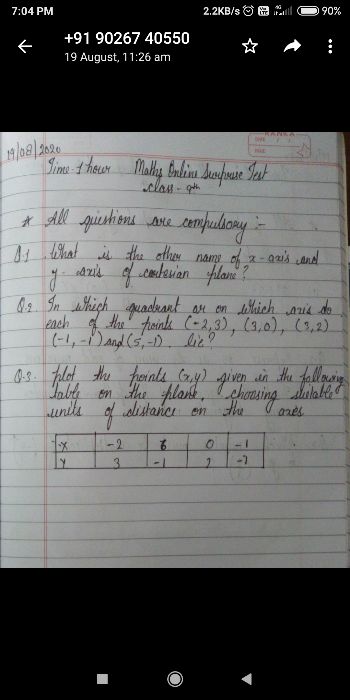
if the coordinate of two points are A( -2,-5) and B(4,-6) then ( abscissa of A) - (abscissa of B) is
Asked by swatipuspapatel | 21 Aug, 2020, 08:38: PM