CBSE Class 11-science Answered
graphs
Asked by Anushasen | 24 Jun, 2009, 08:34: AM
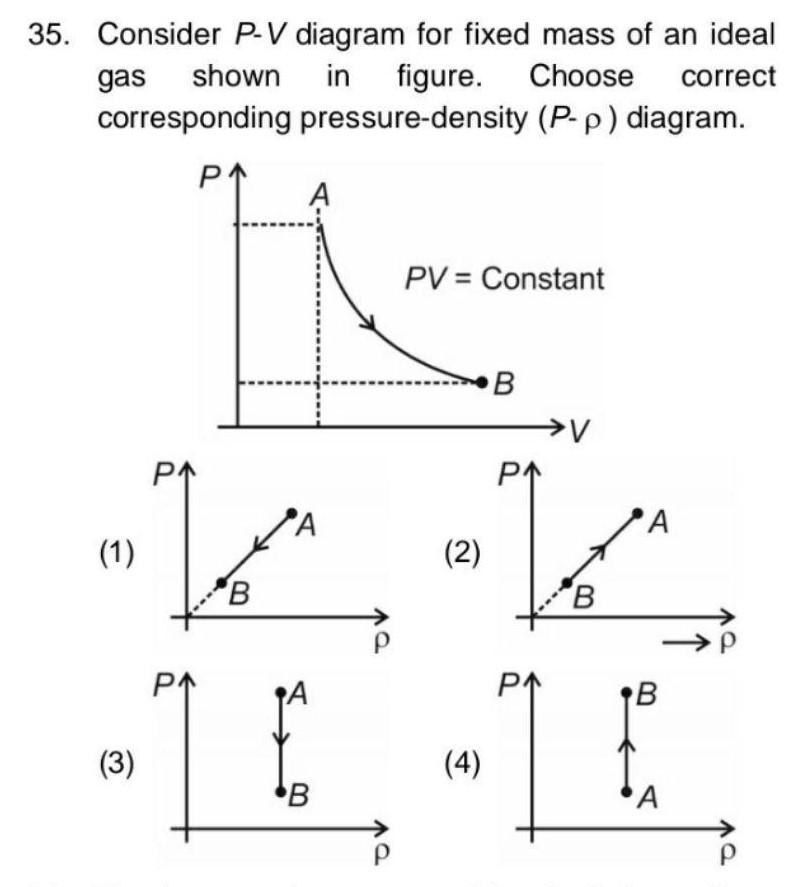
The graphs are asked on Boyle's law, Charles' law and Gay Lussac's law.
Boyle's law:
The first graph is plotted between pressure p and volume V. The graph comes as a curve:
The second graph is between p Vs 1/V. It comes as a straight line.
The third graph is between p Vs pV.
Charles' law:
The graph is plotted between volume and temperature
Gay Lussac's law:
The graph is plotted between pressure and temperature
Answered by | 26 Jun, 2009, 04:24: PM
Concept Videos
CBSE 11-science - Chemistry
Asked by rhythmdraco42 | 22 Apr, 2024, 10:43: PM
CBSE 11-science - Chemistry
Asked by vishalrolaniya2005 | 20 Sep, 2023, 08:58: PM
CBSE 11-science - Chemistry
Asked by khansuhana410 | 22 Dec, 2022, 11:48: AM
CBSE 11-science - Chemistry
Asked by amanpatel95698 | 02 Mar, 2022, 12:09: AM
CBSE 11-science - Chemistry
Asked by neerudhawanbpsmv | 28 Jun, 2021, 09:22: AM
CBSE 11-science - Chemistry
Asked by pushpakumari291279 | 31 Dec, 2020, 02:02: PM
CBSE 11-science - Chemistry
Asked by aryanvankar88 | 11 Oct, 2020, 10:07: PM
CBSE 11-science - Chemistry
Asked by nk581346 | 07 Sep, 2020, 11:08: AM
CBSE 11-science - Chemistry
Asked by swatipuspapatel | 10 Jun, 2020, 06:19: PM
CBSE 11-science - Chemistry
Asked by pratikshyadashrkl | 12 Apr, 2020, 06:47: PM


