
CBSE Class 10 Answered
graph between resistance & temperature
Asked by vaibhavkalind | 20 Dec, 2009, 08:58: PM
In case of multiple questions within a query, please post each question individually and let us know where you are getting stuck so that we would be able to explain things better.
Resistance of conductors increases with an increase in temperature , so the graph will be a straight line inclined at some angle with the x-axis (temp. axis).
Answered by | 20 Dec, 2009, 09:02: PM
Application Videos
-
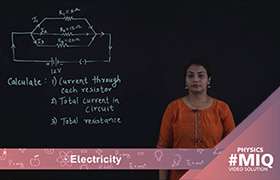
Power rating
 This video shows the calculation of electricity consumed, electric current ...
 -
Some other formulae for calculating power ...
 This video shows explains the application of formula for calculating the po...
 -
Cost of electricity
 This video describes the calculation of cost of electricity for electrical ...
 -
Combination of resistors -parallel
 This video describes the calculation of effective resistance, total current...
 -
Combination of resistors -series
 This video describes the calculation of electric current flowing through th...
Concept Videos
-
Electricity
 Define resistance and resistivity, factors on which they depends. Explain ...
 -
Electricity
 Explain Joule's law of heating, heating effect of electric current, electr...
 -
Electricity
 Explain a series and a parallel combination of resistors in a circuit. Det...
 -
Electricity
 Define electric current, direction of current, ampere, potential differenc...
 -
Electricity
 Define resistance and resistivity, factors on which they depends. Explain ...
CBSE 10 - Physics
Asked by khajannirwan | 27 Feb, 2024, 10:20: PM
CBSE 10 - Physics
Asked by saanviyadla | 24 Jan, 2024, 07:06: PM
CBSE 10 - Physics
Asked by kamalaranjanmohantymohanty5 | 06 Jan, 2024, 10:05: AM
CBSE 10 - Physics
Asked by nandhikasugumar | 05 Oct, 2023, 04:01: PM
CBSE 10 - Physics
Asked by daniya062008 | 02 Oct, 2023, 08:25: PM
CBSE 10 - Physics
Asked by prassanna.j | 03 Sep, 2023, 12:28: PM
CBSE 10 - Physics
Asked by prassanna.j | 03 Sep, 2023, 12:21: PM
CBSE 10 - Physics
Asked by prassanna.j | 03 Sep, 2023, 12:13: PM
CBSE 10 - Physics
Asked by prassanna.j | 03 Sep, 2023, 12:11: PM
