CBSE Class 10 Answered
This is a more than type frequency distribution table. To find the median of this data, draw the graph of this data.
Now, total number of observations in this data, N = 40.
N/2 = 20.
In order to find the median, locate 20 on y-axis. From this point, draw a line parallel to the x-axis cutting the curve at a point. From this point, draw a perpendicular to the x-axis. The point of intersection of this perpendicular with the x-axis determines the median of the data. The median is some what approximately to 34.

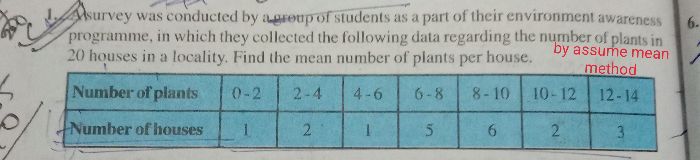
The given data can be converted into a normal class interval frequency distribution as follows:
|
Class interval |
Frequency |
|
0 - 12 |
40 - 37 = 3 |
|
12 - 24 |
37 - 30 = 7 |
|
24 - 36 |
30 - 18 = 12 |
|
36 - 48 |
18 - 13 = 5 |
|
48 - 60 |
13 - 4 = 9 |
|
60 - 72 |
4 |
Application Videos
-
Arithmetic Mean of Ungrouped Data
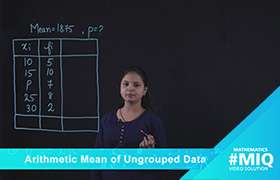 This video explains the Method of finding missing value of the given distri...
 -
Median of Ungrouped Data
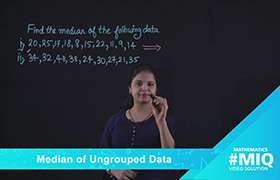 Method of finding Median of the given data, when the numbers the number of ...
 -
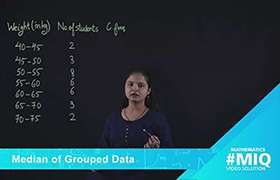
Median of Grouped Data
This videos explains the concept of Mean of a Continuous Frequency Distr...
-
Mean of Grouped Data
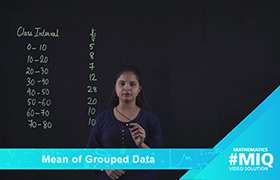 This videos explains the concept of Mean of a Continuous Frequency Distribu...
 -
Mode of Ungrouped Data
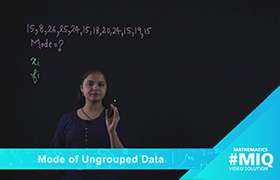 This video explain the Mode of the discrete data.
Concept Videos
-
Arithmetic Mean of Grouped Data
 This video explains how to calculate arithmetic mean of grouped data by usi...
 -
Mode of Grouped Data ...
 Types of data, Revisit MODE for ungrouped data, calculation of MODE for gr...
 -
Relation Between Central Tendencies
 This video explains the most frequently used measure of central tendency i....
 -
Cumulative Frequency Curve
 Representation of cumulative frequency distribution with the help of ogiv...
 -
About median of grouped data
 This video is based on median of grouped data.