
CBSE Class 11-science Answered
DRAW THE DISTANCE-TIME GRAPH AND VELOCITY-TIME GRAPH FOR AN OBJECT MOVING WITH NEGATIVE ACCELERATION.
Asked by swarajtopper | 30 Jul, 2015, 05:15: PM
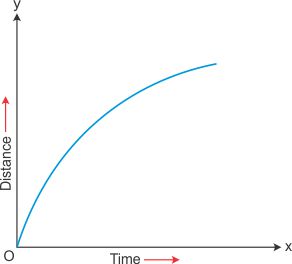
An object is moving with negative acceleration.
Hence, initially it travels the maximum distance and the distance travelled in each interval of time reduces.
That is, the distance travelled in 2nd second will be less than that travelled in the 1st second.
So, the graph will be a curve as shown in the figure below:
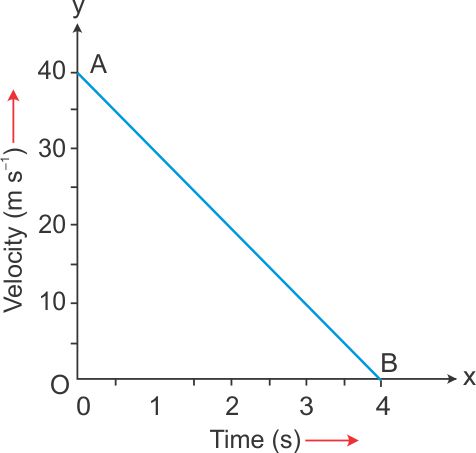
Now, the velocity of the object goes on decreasing linearly with time as it is decelerating.
Its graph will be as shown below:
Answered by Romal Bhansali | 31 Jul, 2015, 04:39: PM
Concept Videos
-
Motion in a Straight Line

-
Motion in a Straight Line

-
Motion in a Straight Line

CBSE 11-science - Physics
Asked by subhashreeojha235 | 16 Jul, 2023, 07:37: PM
CBSE 11-science - Physics
Asked by sush75 | 15 Mar, 2022, 04:02: PM
CBSE 11-science - Physics
Asked by abhishekchoudhary236 | 11 Nov, 2020, 10:09: PM
CBSE 11-science - Physics
Asked by chera5cibi | 28 Oct, 2020, 05:45: AM
CBSE 11-science - Physics

Asked by pushkarnannu4 | 05 Oct, 2020, 07:17: AM
CBSE 11-science - Physics
Asked by frontech990 | 06 Feb, 2019, 02:21: PM
CBSE 11-science - Physics
Asked by Topperlearning User | 04 Jun, 2014, 01:23: PM
CBSE 11-science - Physics
Asked by Topperlearning User | 04 Jun, 2014, 01:23: PM
CBSE 11-science - Physics
The graph represents the velocity time for the first 4 seconds of motion. Find the distance covered. 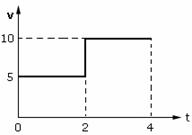
Asked by Topperlearning User | 04 Jun, 2014, 01:23: PM
CBSE 11-science - Physics
Asked by Topperlearning User | 04 Jun, 2014, 01:23: PM
