
CBSE Class 9 Answered
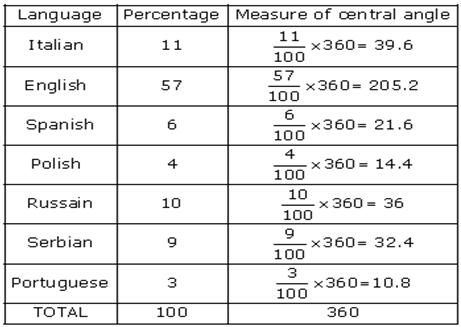
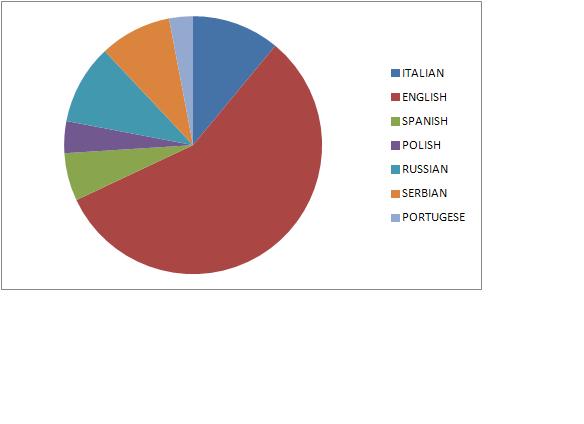
Draw a pie chart for below: (From OTBA)
Language Italian English Spanish Polish Russain Serbian Portuguese
Percentage 11 57 6 4 10 9 3
Asked by singhaivk05 | 26 Feb, 2015, 09:26: PM
Answered by Rohit Ranawat | 27 Feb, 2015, 09:51: AM


Concept Videos
-
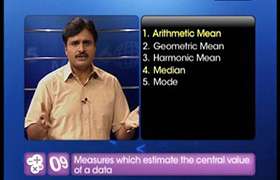
Measures of Central Tendency
 Explore the three main measures of central tendency, namely mean, median a...
 -
Measures of Central Tendency
 Explore the three main measures of central tendency, namely mean, median a...
 -
Measures of Central Tendency
 Explore the three main measures of central tendency, namely mean, median a...
CBSE 9 - Maths
Asked by 16presa1186 | 09 Jan, 2023, 07:55: PM
CBSE 9 - Maths
Asked by Princevekariaya | 04 Apr, 2021, 01:57: PM
CBSE 9 - Maths
Asked by swatipuspapatel | 12 Jan, 2021, 07:21: PM
CBSE 9 - Maths
Asked by tapiawalabipin | 09 Jan, 2020, 08:43: AM
CBSE 9 - Maths
Asked by anish.ravesh | 07 Jul, 2019, 12:14: PM
CBSE 9 - Maths
Asked by Vvirattiger2003 | 02 Apr, 2019, 04:53: AM
CBSE 9 - Maths
Asked by Topperlearning User | 18 Aug, 2017, 01:57: PM
CBSE 9 - Maths
Asked by Topperlearning User | 18 Aug, 2017, 02:05: PM
CBSE 9 - Maths
Asked by Topperlearning User | 18 Aug, 2017, 01:57: PM
CBSE 9 - Maths
Asked by Topperlearning User | 04 Jun, 2014, 01:23: PM
