
CBSE Class 11-science Answered
Can you please explain me the inequality in the given image of x²≤a², so -a≤x≤a.
Asked by Varsneya Srinivas | 29 Dec, 2016, 09:43: AM
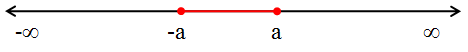
The graph of x²≤a², which is, -a≤x≤a is as shown in the figure below.
Since -a≤x≤a, it means x can take any of the real values from -a to a including
-a and a (cause of the less than or equal to symbol).
So, in the figure below, the red part is the graph of the inequality.
The two red completely filled end-points represent the points -a and a which are also included
in the solution.
Answered by Rebecca Fernandes | 29 Dec, 2016, 11:00: AM
Concept Videos


CBSE 11-science - Maths
Asked by Praktu111 | 09 Jun, 2019, 08:18: AM
CBSE 11-science - Maths
Asked by sudhanshubhushanroy | 20 Mar, 2018, 10:12: PM
CBSE 11-science - Maths
Asked by Topperlearning User | 13 Nov, 2016, 08:09: PM
CBSE 11-science - Maths
Asked by Topperlearning User | 25 Apr, 2014, 11:37: AM
CBSE 11-science - Maths
Asked by Topperlearning User | 25 Apr, 2014, 11:38: AM
CBSE 11-science - Maths
Asked by Topperlearning User | 25 Apr, 2014, 11:38: AM
CBSE 11-science - Maths
Asked by Topperlearning User | 25 Apr, 2014, 11:39: AM
CBSE 11-science - Maths
Asked by Topperlearning User | 25 Apr, 2014, 11:39: AM
CBSE 11-science - Maths

Asked by Topperlearning User | 25 Apr, 2014, 11:40: AM
CBSE 11-science - Maths
Asked by Topperlearning User | 25 Apr, 2014, 10:58: AM
