ICSE Class 10 Answered
(a) Oxygen gas was produced by the plant during the experiment.
(b) The gas collected comes due to the breakdown of water.
(c) If ice cubes are added to the water in the beaker, the rate of bubble formation would decrease because of a drop in temperature.
(d) If limewater is added to the surrounding water, the rate of bubble formation would decrease because carbon dioxide acts as a limiting factor.
(e) Light intensity is inversely proportional to the square of the distance. Therefore, as the distance of the light source is increased, the light intensity decreases. The expected graph would show a downward sloping curve as the distance of the light source increases. Less oxygen bubbles are produced as the light source moves away from the bell jar. Ideally, the expected results would be as follows, although it again depends on the experimental values obtained during the experiment.
|
Distance of lamp from bell jar (cm) |
Number of bubbles given off per minute |
|
10 |
20 |
|
20 |
10 |
|
40 |
5 |
|
60 |
3 |
|
80 |
1 |
|
100 |
0 |
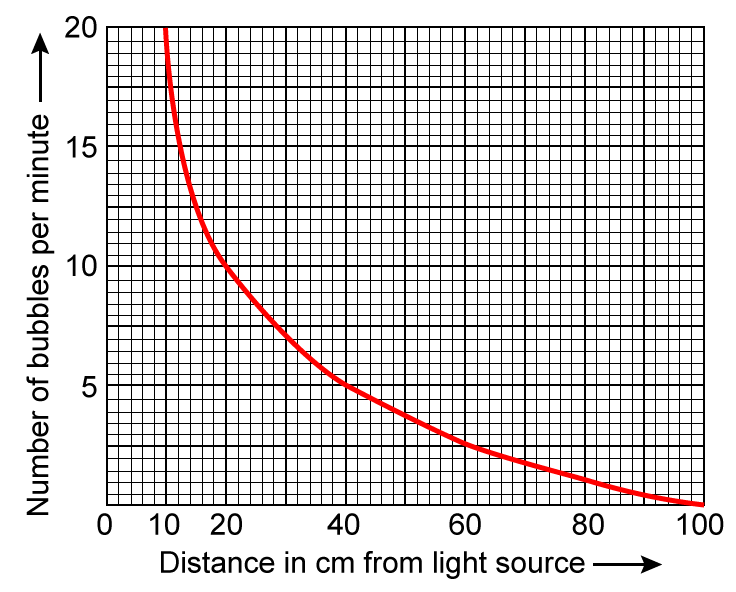
(Note: The graph shown is for representation purpose. The graph points may vary depending on the actual values obtained during the experiment)
This shows that greater the light intensity, greater is the rate of photosynthesis. However, one of the major sources of inaccuracy of the experiment would be the size of the bubbles. When counting bubbles, the bubbles may be of varied sizes, leading to inaccurate conclusions about the rate of oxygen production.
Concept Videos
-
Photosynthesis - Provider of Food for All
 Photosynthesis - Provider of Food for All, Factors Affecting Photosynthesis