
CBSE Class 8 Answered
A man with
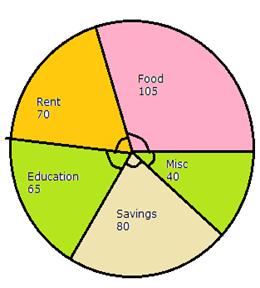
a monthly salary of Rs 10800 plans his budget for a month as given below:
Item
Food
Rent
Education
Savings
Misc
Amount
3150
2100
1950
2400
1200
Represent
the above data by a pie chart.
Asked by Topperlearning User | 04 Jun, 2014, 01:23: PM
Total money: Rs 10800

To work out the angle of each segment, work out the fraction of the total that each item got.
Start with food:![]()
There are 360° in a full turn, so to work out the angle, multiply the fraction by 360:
The food sector has an angle of 105°
Repeat this process to find the angle of the segments for the other items.
Once you have calculated the angles of the segments, construct the pie chart
|
Item |
Amount |
Central Angle |
|
Food |
3150 |
|
|
Rent |
2100 |
|
|
Education |
1950 |
|
|
Savings |
2400 |
|
|
Misc |
1200 |
|
Answered by | 04 Jun, 2014, 03:23: PM
Application Videos

Concept Videos
CBSE 8 - Maths
Asked by krushnagavande1978 | 05 Aug, 2019, 07:48: AM
CBSE 8 - Maths
Asked by Topperlearning User | 04 Jun, 2014, 01:23: PM
CBSE 8 - Maths
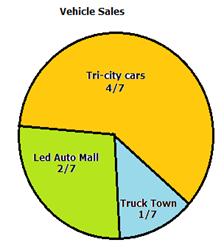 The local dealerships sold a total of 35 vehicles. How many more vehicles were sold by Led Auto Mall than by Truck Town?
Asked by Topperlearning User | 30 May, 2014, 10:44: AM
CBSE 8 - Maths
Asked by Topperlearning User | 04 Jun, 2014, 01:23: PM
CBSE 8 - Maths
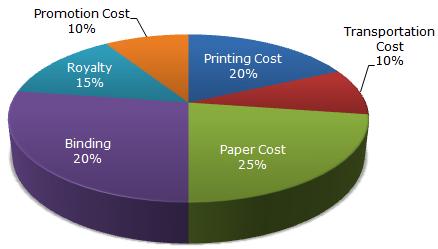 i) If for a certain quantity of books, the publisher has to pay Rs. 30,600 as printing cost, than what will be amount of royalty to be paid for these books?
ii) What is the central angle of the sector corresponding to the expenditure incurred on Royalty?
i) If for a certain quantity of books, the publisher has to pay Rs. 30,600 as printing cost, than what will be amount of royalty to be paid for these books?
ii) What is the central angle of the sector corresponding to the expenditure incurred on Royalty?Asked by Topperlearning User | 04 Jun, 2014, 01:23: PM
CBSE 8 - Maths
Asked by Topperlearning User | 30 May, 2014, 10:48: AM
CBSE 8 - Maths
Asked by Topperlearning User | 04 Jun, 2014, 01:23: PM
CBSE 8 - Maths
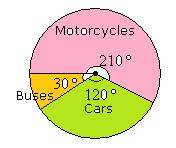 a) What fraction of the vehicles were motorcycles?
b) What percentage of vehicles passing by the junction were cars?
c) Calculate the total number of vehicles in the survey.
d) How many cars were included in the survey?
a) What fraction of the vehicles were motorcycles?
b) What percentage of vehicles passing by the junction were cars?
c) Calculate the total number of vehicles in the survey.
d) How many cars were included in the survey?Asked by Topperlearning User | 30 May, 2014, 10:46: AM
CBSE 8 - Maths
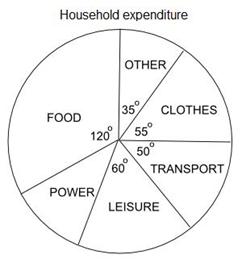 i) If the expenditure on food is Rs 300, what is the expenditure on transport?
ii) What percentage of the family's income is spent on power?
i) If the expenditure on food is Rs 300, what is the expenditure on transport?
ii) What percentage of the family's income is spent on power?Asked by Topperlearning User | 30 May, 2014, 10:43: AM
CBSE 8 - Maths
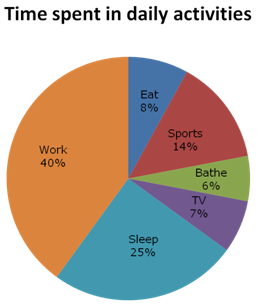 What is the angle for the sector of the pie chart representing the time he spends on sport?
Asked by Topperlearning User | 02 Dec, 2015, 09:47: AM
